TuranMart’s platform has reached an important turning point. Earlier chapters built ingestion, storage, transformation, streaming, orchestration, and analytics engineering capabilities. The company can now move data from operational systems into trusted analytical tables and dashboards. Yet the executive team still asks a harder question: Can we trust the platform when nobody is watching it manually?
A pipeline can appear healthy while producing stale data. A dashboard can load quickly while showing yesterday’s revenue. A transformation can finish successfully while silently dropping a region because a source column changed. These are reliability failures, even if every server is technically running. OpenTelemetry describes reliability as whether a service does what users expect, not merely whether it is up.1 In data engineering, the user expectation is usually not “the job exited with status zero.” It is “the right data arrived, on time, at the expected quality level, with enough evidence to explain what happened.”
This chapter introduces data observability and pipeline reliability as the operating discipline that makes data products dependable. Observability gives engineers the telemetry, metadata, lineage, and logs needed to answer new questions about a system from the outside.1 Reliability turns those signals into objectives, alerts, incident response, and continuous improvement. Together, they form the reliability layer of the data platform.
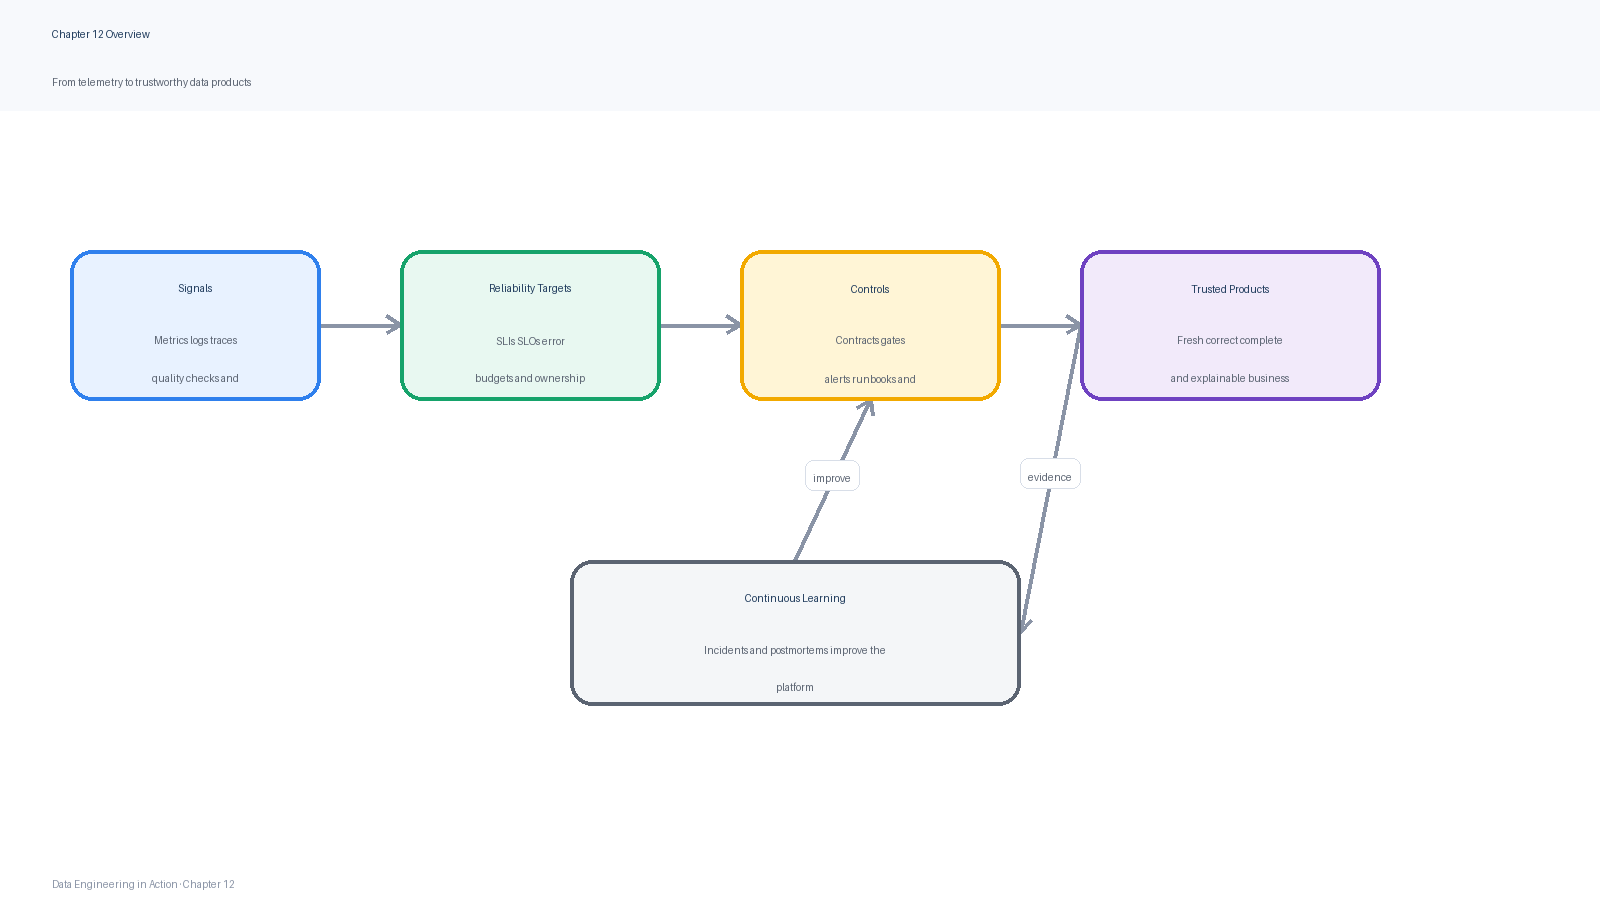
Figure 1:Chapter overview: observability and reliability convert raw telemetry, data quality checks, lineage, contracts, and incident practices into trusted data products.
By the end of the chapter, TuranMart’s data platform will no longer be judged only by whether pipelines run. It will be judged by whether the platform can prove freshness, correctness, completeness, ownership, and recovery behavior for the data products that the business depends on.
Learning Objectives
By the end of this chapter, you should be able to explain the difference between monitoring and observability in a data platform. You should be able to define practical service-level indicators for batch and streaming data products, translate those indicators into service-level objectives, and reason about error budgets. You should also be able to design telemetry for metrics, logs, traces, lineage, and data-quality validation so that failures are visible before users discover them.
Most importantly, you should be able to operate data pipelines as reliable services. In the guided lab, you will build a deterministic local observability harness for a TuranMart revenue pipeline. The lab emits run metrics, structured logs, lineage events, contract-validation results, expected outputs, and an incident playbook artifact. This makes Chapter 12 the bridge between building pipelines and running them professionally.
| Capability | Practical outcome in this chapter |
|---|---|
| Observability design | Instrument a data product with metrics, logs, traces, quality checks, contracts, and lineage instead of relying on ad hoc debugging. |
| Reliability measurement | Define SLIs, SLOs, and error budgets for freshness, completeness, correctness, latency, and recovery. |
| Data-quality operations | Convert business assumptions into executable checks with severity, failure scope, and remediation evidence. |
| Lineage and blast-radius analysis | Use dataset, job, and run metadata to identify affected consumers when a pipeline or source changes. |
| Incident response | Use alert rules, severity levels, ownership, command roles, and postmortems to recover from data incidents. |
12.1 From Monitoring to Observability
Monitoring tells a team whether known conditions are currently true. A monitor can say that the daily_sales job failed, the row count is below a threshold, the scheduler heartbeat is stale, or the dashboard table has not been updated by 07:30. These checks are necessary, but they are not sufficient. Production incidents often begin with unknown conditions: a source emits valid JSON with a new meaning, a retry creates duplicate records, a dimension table arrives late, or a warehouse permission change breaks only one consumer. Observability exists so engineers can ask new questions about the system without deploying new probes during the incident.
OpenTelemetry defines observability as the ability to understand a system from the outside and ask why something is happening without already knowing the inner workings.1 It also describes telemetry as data emitted by systems in the form of traces, metrics, and logs.1 A data platform extends that model with data-specific evidence: freshness, row counts, schema versions, quality results, lineage events, contract metadata, ownership, and incident history.
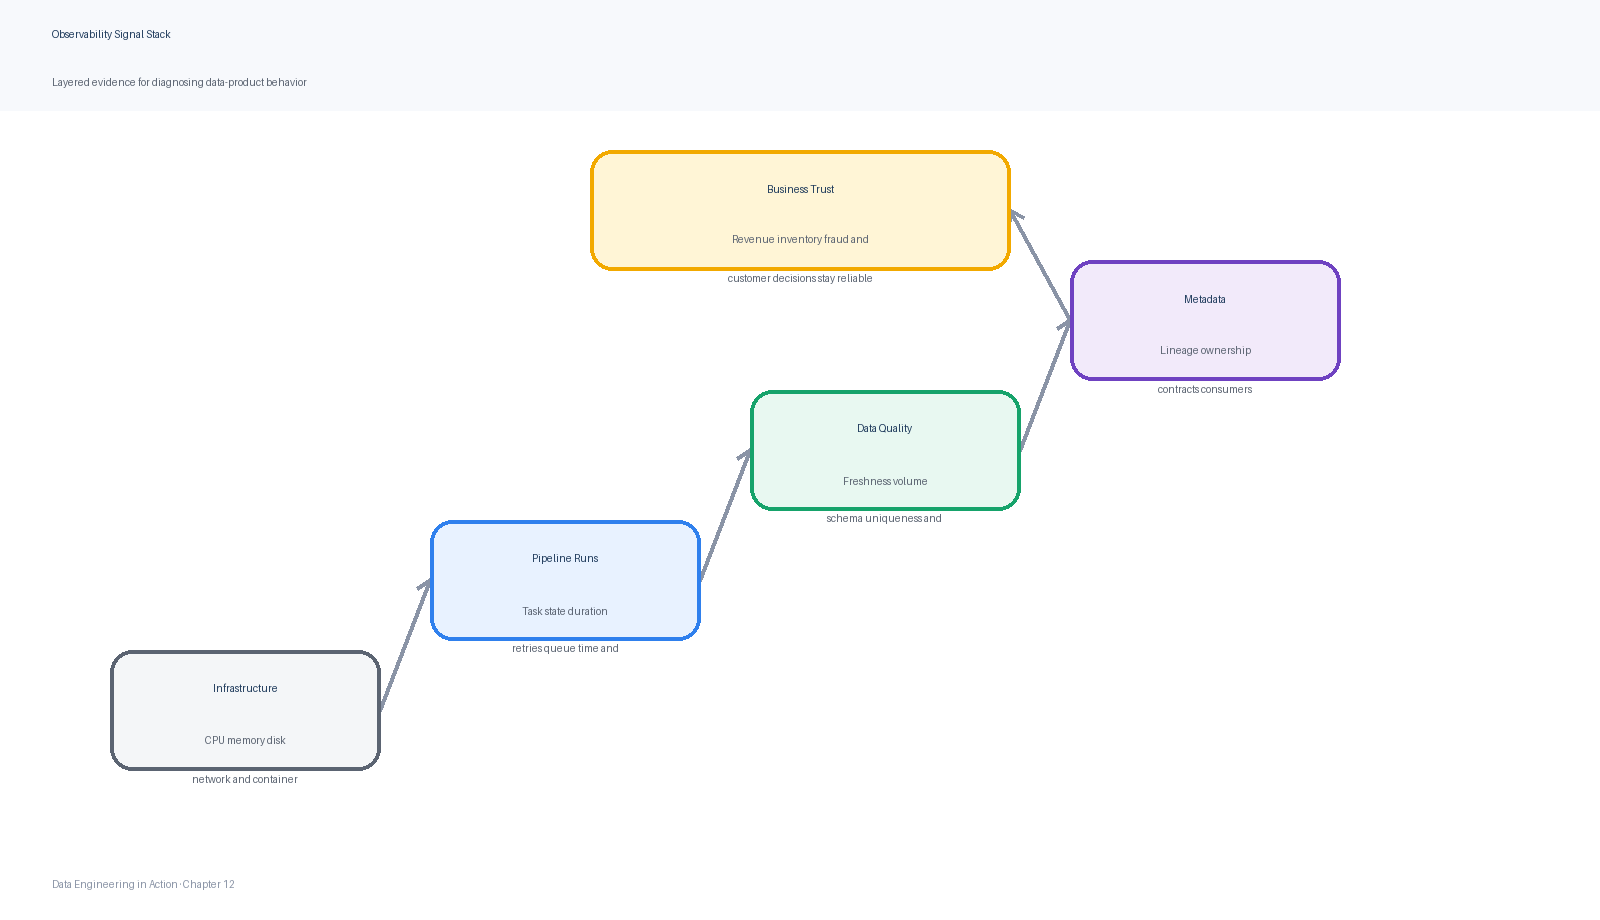
Figure 2:The data observability signal stack combines platform telemetry with data-specific evidence such as freshness, volume, quality, lineage, contracts, and ownership.
The distinction matters because a data pipeline can have strong infrastructure monitoring and weak data observability. CPU, memory, and task status can look normal while a business metric is wrong. Conversely, a high-quality observability design lets the team answer questions such as “Which upstream source changed?”, “Which partitions are stale?”, “Which consumers are affected?”, “Did this failure already breach the SLO?”, and “Is the incident getting better or worse?”
| Signal | Traditional monitoring question | Data-observability question |
|---|---|---|
| Job status | Did the task process exit successfully? | Did the task produce the correct partition and publish it atomically? |
| Logs | What exception was thrown? | Which dataset, partition, contract, owner, and run identifier does the event belong to? |
| Metrics | Is CPU or memory high? | Is freshness, completeness, duplicate rate, or validation success within the SLO? |
| Traces | Which services handled this request? | Which extraction, validation, transformation, and publishing steps created this data version? |
| Lineage | Not usually captured. | Which downstream dashboards, models, and tables depend on the broken dataset? |
| Contracts | Not usually captured. | Which producer promise changed, and who accepted or rejected that change? |
A practical observability design begins with the data product, not the tool. TuranMart’s gold.daily_revenue table is useful only if store managers receive complete, timely, correct, and explainable numbers. The observability plan should therefore record the run identifier, logical date, source extract timestamp, input record count, rejected record count, output row count, revenue total, schema hash, validation status, publishing time, and downstream lineage. These signals give the on-call engineer a compact operating picture.
Definition: Data observability is the ability to understand the state, quality, freshness, lineage, and operational behavior of data products from external evidence, without rewriting the pipeline during an incident.
12.2 Reliability Metrics: SLIs, SLOs, SLAs, and Error Budgets
Reliability becomes actionable only when teams define what “working” means. Google SRE defines a service-level indicator, or SLI, as a carefully defined quantitative measure of a service level, and a service-level objective, or SLO, as a target value or range for that indicator.2 An SLA is different because it includes explicit consequences when SLOs are not met.2 This distinction is useful for data teams because most internal data products need SLOs before they need formal legal agreements.
For data pipelines, the most useful SLIs usually measure user-visible data behavior. Google SRE notes that big data systems often care about throughput and end-to-end latency, while all systems should care about correctness.2 A data team can translate those ideas into freshness, completeness, validity, duplication, reconciliation, and recovery indicators. The goal is not to measure everything. The goal is to choose a small number of indicators that reveal whether the business promise is being kept.
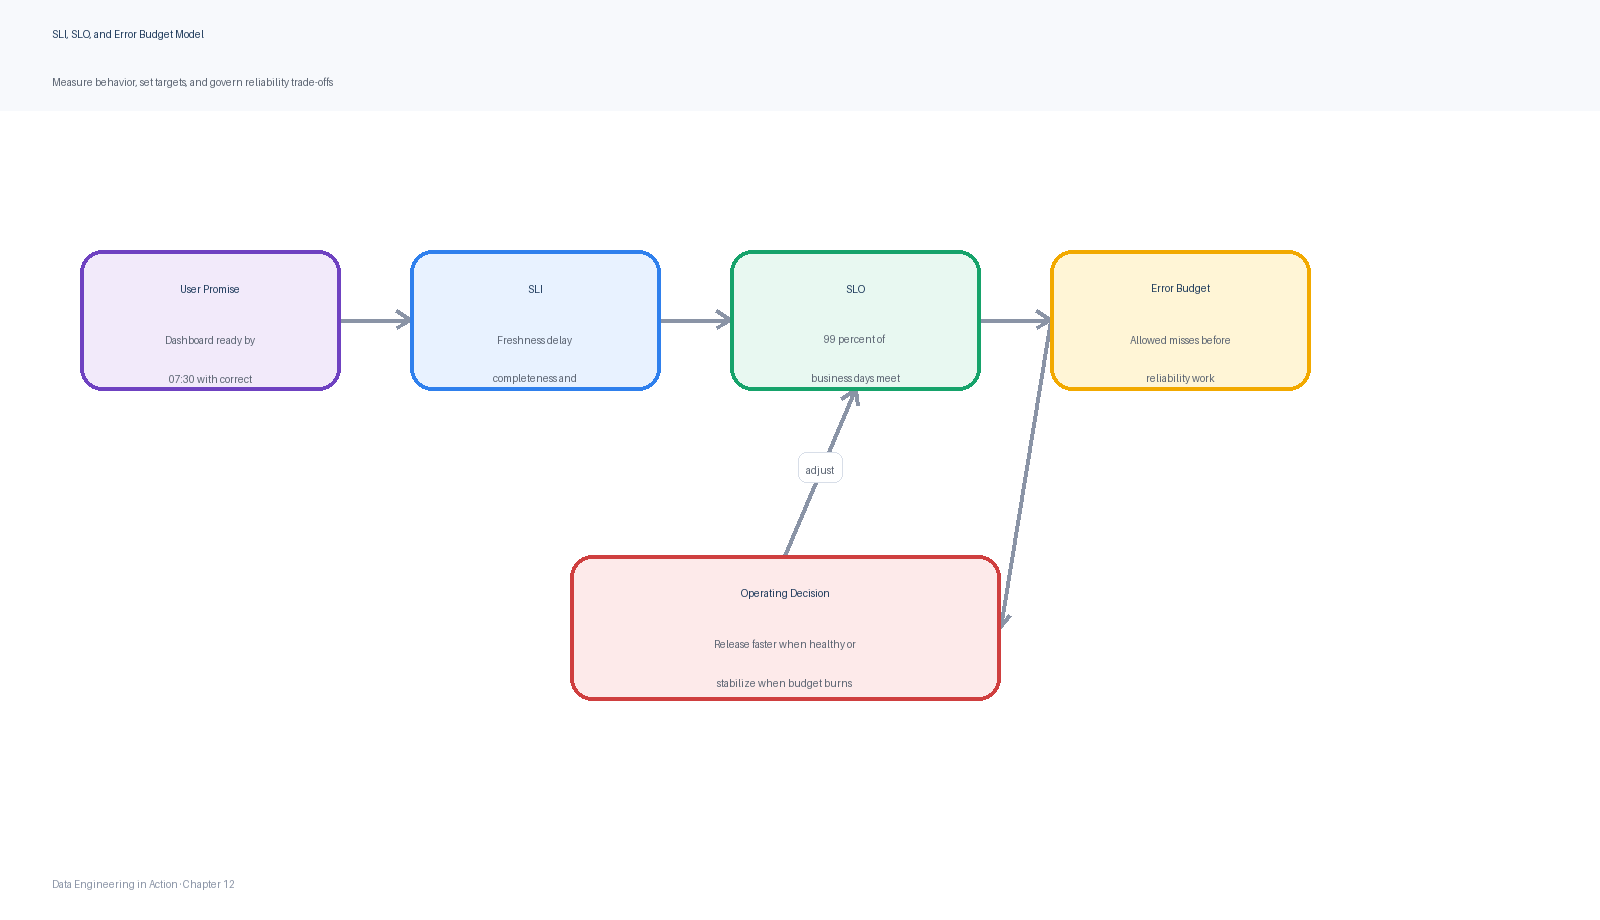
Figure 3:Reliability model for a data product: SLIs measure behavior, SLOs define targets, error budgets describe tolerated failure, and operating decisions control the rate of budget consumption.
| Data-product promise | Example SLI | Example SLO | Typical owner |
|---|---|---|---|
| Morning dashboards are ready for stores. | Freshness delay between logical date close and published gold.daily_revenue. | 99% of business-day partitions published by 07:30 local time. | Data platform and analytics engineering. |
| Revenue totals reconcile with orders. | Absolute difference between source order revenue and gold-table revenue. | Difference is less than 0.1% for each daily partition. | Analytics engineering. |
| Customer behavior features are usable for models. | Feature table completeness by required feature column. | At least 99.5% non-null values for production-critical features. | ML platform and source-domain owners. |
| Streaming fraud signals are recent. | Event-time lag at p95. | p95 lag below five minutes during business hours. | Streaming platform. |
| Published tables are understandable. | Percentage of critical tables with owner, contract, lineage, and freshness metadata. | 100% of tier-one tables have operational metadata. | Data governance and platform. |
An error budget is the amount of unreliability allowed by the SLO. If TuranMart promises that 99% of daily revenue partitions are published on time each quarter, then approximately 1% of those partitions can miss the target before the team has exhausted the budget. Error budgets turn reliability conversations into engineering trade-offs. If the budget is healthy, the team may accept more change and experimentation. If the budget is burning quickly, the team should reduce risky releases, fix root causes, and improve automation.
Not every SLI should be an average. Google SRE warns that averages can hide tail behavior and recommends thinking of many metrics as distributions.2 Freshness is a clear example. A mean delay of ten minutes can hide a few late partitions that break executive reporting. For user-facing analytical products, p95 and p99 freshness are often more useful than average freshness.
| Metric design choice | Weak version | Stronger version |
|---|---|---|
| Freshness | “Average pipeline delay is under 30 minutes.” | “p95 business-day partition freshness is under 30 minutes, and no tier-one partition is later than 07:30.” |
| Quality | “The validation job usually passes.” | “Critical expectations pass for every published partition; warning expectations are tracked with counts and percentages.” |
| Completeness | “The table has rows.” | “Daily order count is within expected control limits and reconciles with source totals by store.” |
| Recovery | “Someone fixes failures.” | “Transient failures recover automatically; critical incidents have mean time to acknowledge below 15 minutes.” |
| Ownership | “The data team owns it.” | “Every tier-one data product has a named business owner, technical owner, escalation route, and contract.” |
For TuranMart, the first reliability layer should cover the most important data products rather than every table. Tier-one products include executive revenue, order fulfillment analytics, fraud monitoring features, and inventory replenishment tables. Lower-tier exploratory datasets still need basic metadata, but they do not need the same paging policy as a board-level revenue dashboard.
12.3 Instrumenting Pipelines with Metrics, Logs, and Traces
The first rule of instrumentation is that every signal should be joinable. A log line, metric point, validation result, lineage event, and incident note should share identifiers such as pipeline name, run ID, logical date, dataset name, partition, environment, code version, and owner. Without those identifiers, the team receives disconnected clues. With them, an engineer can reconstruct the story of a data product run.
OpenTelemetry describes logs as timestamped messages, metrics as numeric aggregations over time, spans as units of work, and traces as paths through distributed systems.1 These concepts map naturally to data pipelines. A pipeline run is a trace. Extraction, validation, transformation, and publishing tasks are spans. Row counts, freshness, rejected records, and validation success rates are metrics. Structured events describing decisions and failures are logs.
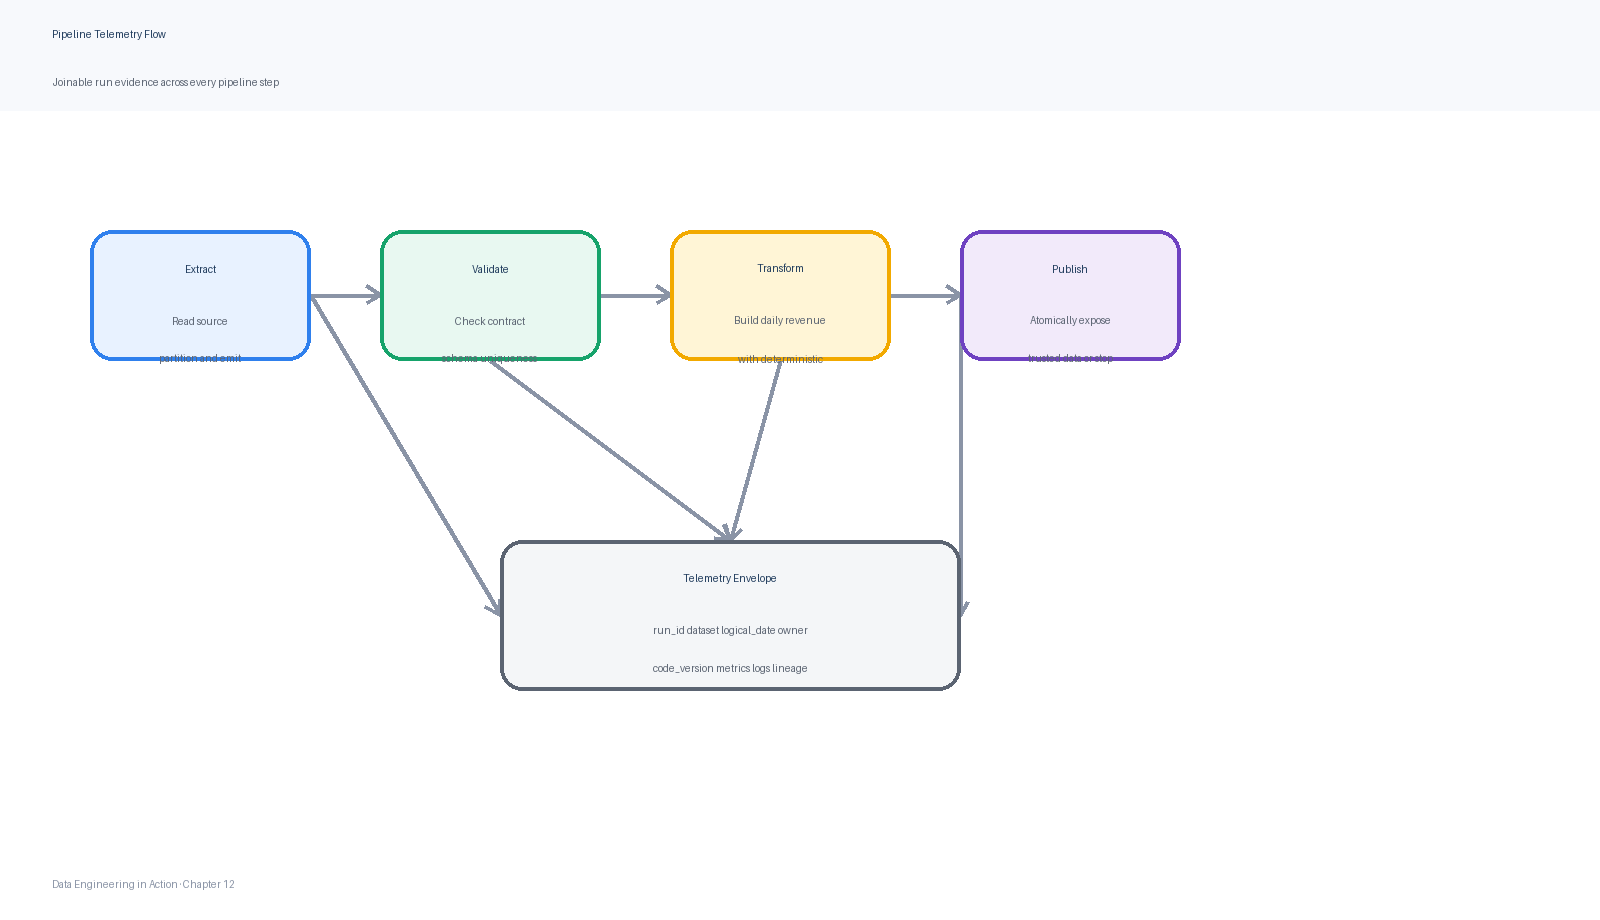
Figure 4:A pipeline telemetry flow records structured logs, run metrics, validation results, and trace-like step spans with common identifiers so incidents can be reconstructed quickly.
A minimal telemetry envelope for a batch pipeline should be boring and consistent. It should not depend on the personal style of the engineer who wrote the task. The following table shows a practical schema for TuranMart pipeline events.
| Field | Example | Why it matters |
|---|---|---|
run_id | daily_revenue__2026-05-03__001 | Connects all telemetry from the same execution. |
pipeline | daily_revenue | Groups alerts, dashboards, and ownership. |
dataset | gold.daily_revenue | Identifies the data product being protected. |
logical_date | 2026-05-03 | Separates data time from processing time. |
step | validate_contract | Locates failure within the pipeline lifecycle. |
severity | info, warning, critical | Supports routing and incident priority. |
code_version | Git commit hash | Connects failures to deployed changes. |
owner | analytics-platform | Makes escalation explicit. |
Instrumentation should also distinguish processing success from data success. A Python function can exit cleanly after writing an empty file. A SQL statement can complete after filtering away all rows. A streaming consumer can stay alive while lag grows beyond the business tolerance. The platform should therefore emit both technical metrics and data-product metrics.
| Technical metric | Data-product metric |
|---|---|
| Task duration | Freshness delay for the published partition. |
| Retry count | Number of affected downstream datasets. |
| Process exit status | Contract validation status and failed expectation count. |
| Worker memory usage | Reconciliation difference between source and target totals. |
| Scheduler delay | Business deadline remaining before SLO breach. |
Traces are especially useful when a data product crosses many systems. For example, a fraud feature may start in Kafka, be transformed by Flink, land in object storage, be joined in Spark, and then be served from a feature store. Distributed tracing makes it easier to see which span added latency or failed in a way that is difficult to reproduce locally.1 In data engineering, lineage complements tracing by showing dataset dependencies and consumers.
12.4 Data Quality Checks and Data Contracts
Data-quality checks are executable promises. Great Expectations describes expectations as explicit definitions of the state to which data should conform and shows validation results with success status, unexpected counts, percentages, and failed values.3 This is the right mental model for production data engineering. A check should not merely say “bad data.” It should say which expectation failed, how many rows were affected, how severe the failure is, and whether publishing should stop.
Quality checks should be placed at multiple points in the pipeline. Raw-zone checks verify arrival, schema, parseability, and basic volume. Silver-zone checks verify normalization, deduplication, type conversion, and referential integrity. Gold-zone checks verify business rules, reconciliation, and consumer-facing semantics. The deeper the pipeline stage, the more business-aware the checks become.
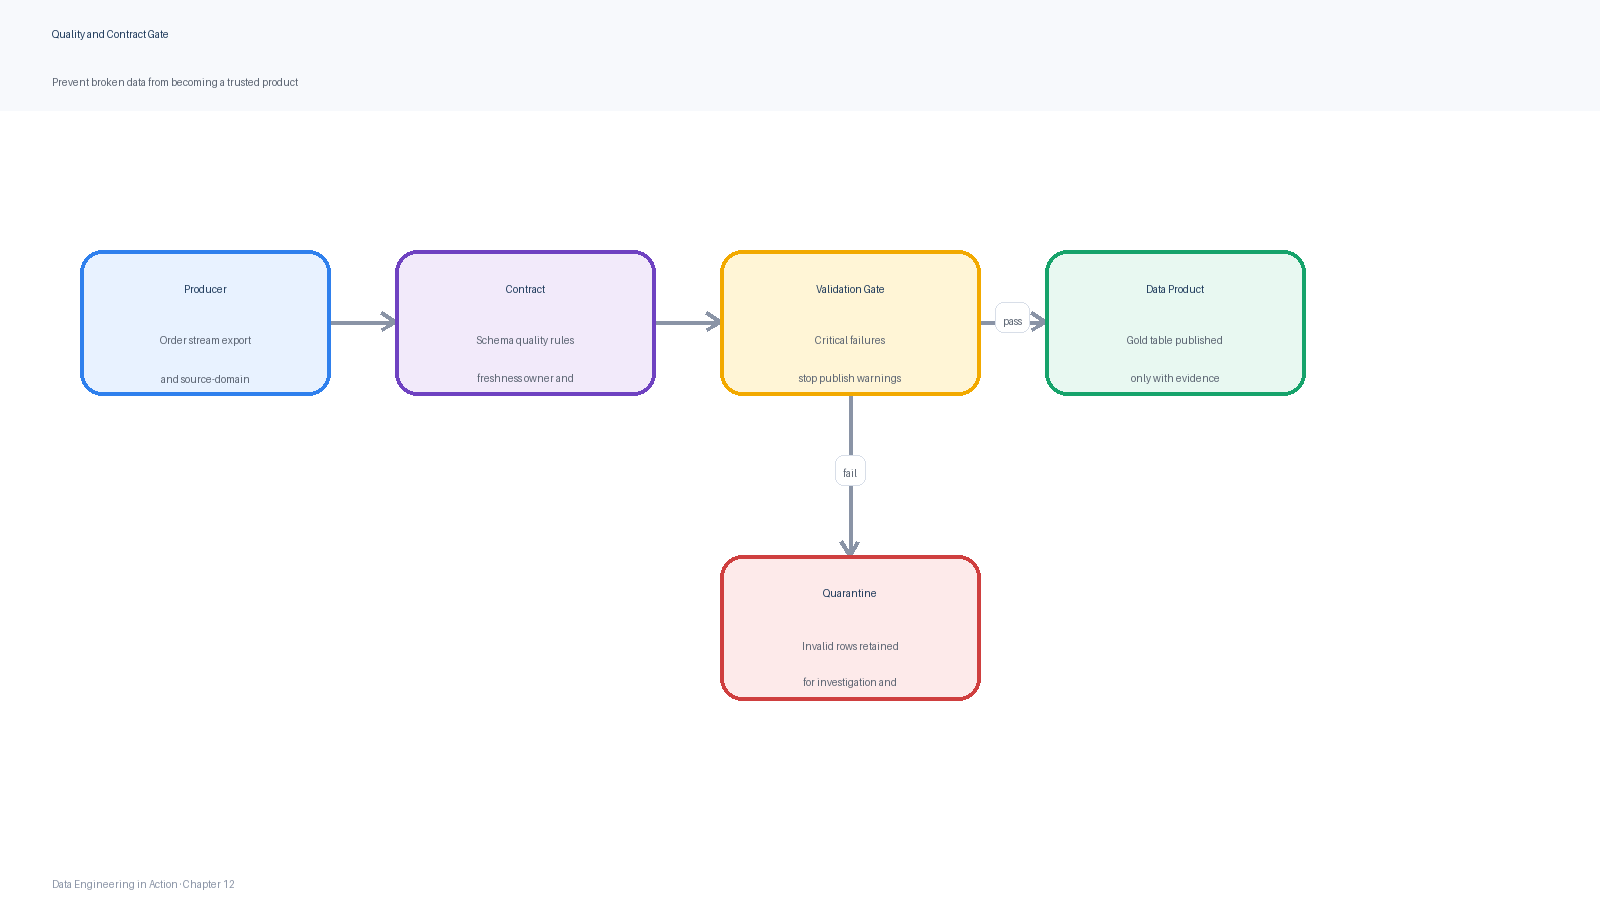
Figure 5:A quality and contract gate prevents broken data from being published by combining schema validation, business rules, severity levels, ownership, and release decisions.
| Check category | Example TuranMart rule | Failure action |
|---|---|---|
| Schema | order_id, store_id, order_ts, currency, and gross_amount are required. | Stop publishing and alert the producer owner. |
| Completeness | Daily order count is within expected control limits for each active store. | Warn if mild; stop if a tier-one store is missing. |
| Validity | gross_amount is non-negative and currency is in the allowed list. | Quarantine invalid rows and fail if the rate exceeds threshold. |
| Uniqueness | order_id is unique within the source partition. | Stop publishing because revenue would be duplicated. |
| Reconciliation | Gold revenue matches accepted source revenue within tolerance. | Stop publishing and open an incident for tier-one reporting. |
| Timeliness | Source extract arrives before the freshness deadline. | Alert before breach; escalate when error budget burn is high. |
A data contract moves these expectations upstream into a producer-consumer agreement. The Open Data Contract Standard describes platform-agnostic YAML contracts with sections such as schema, data quality, support channels, team, roles, service-level agreement, infrastructure, and custom properties.4 That scope is important. A data contract is not only a schema file. It is an operational interface that says what the producer promises, who owns it, how changes are communicated, and what quality or timeliness guarantees consumers can expect.
A practical TuranMart contract for the order stream might specify required fields, allowed currencies, the uniqueness key, supported schema evolution rules, a freshness target, owner contacts, and the escalation route. A compatible producer change can add an optional nullable field. A breaking change, such as renaming gross_amount to amount, requires review, versioning, migration, and downstream acceptance.
| Contract element | Operational purpose |
|---|---|
| Schema | Defines field names, types, nullability, and compatibility expectations. |
| Quality rules | Converts producer assumptions into executable validation. |
| Ownership | Identifies producer and consumer contacts before an incident. |
| Support channel | Provides the communication path for questions and incidents. |
| SLA or SLO section | Defines freshness, delivery, and availability expectations. |
| Change policy | Describes how compatible and breaking changes are proposed and approved. |
Contracts do not remove the need for validation. They make validation less surprising. The pipeline should still enforce the contract at runtime because the contract is only valuable when violations are visible and actionable.
12.5 Lineage, Blast Radius, and Change Management
Lineage answers the question “What depends on this?” OpenLineage defines an open framework for lineage collection and analysis, with a core model of datasets, jobs, and runs that can be enriched through facets.5 This model fits the operational needs of data teams because a reliability incident is rarely isolated to one table. A failed source extract may affect a dashboard, an ML feature table, a regulatory report, and a partner export.
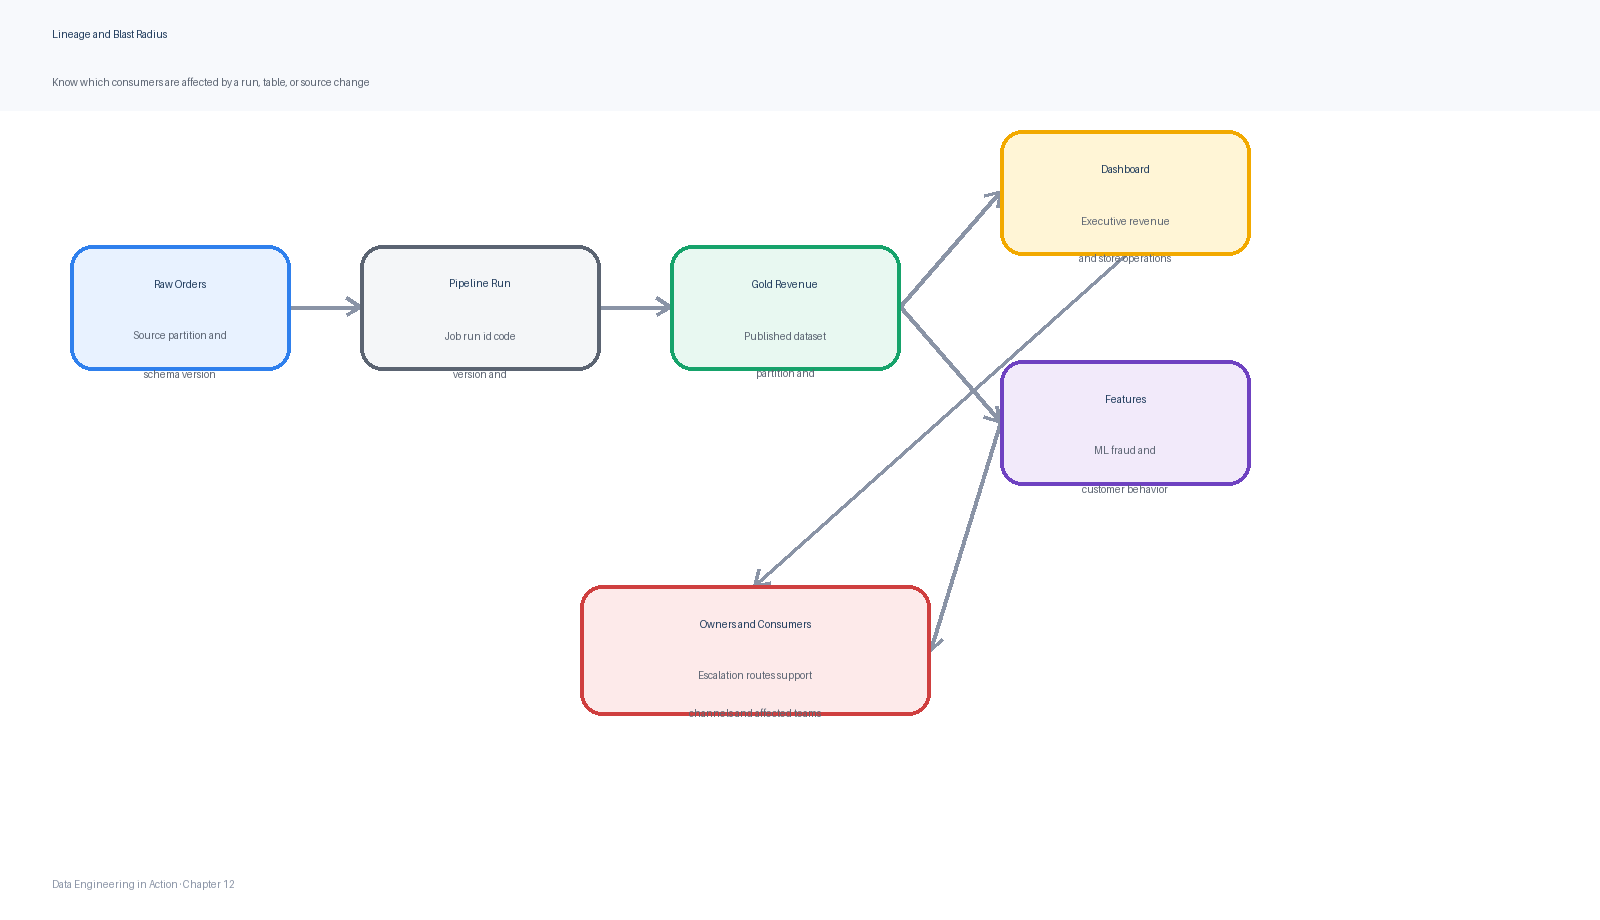
Figure 6:Lineage supports blast-radius analysis by linking source datasets, jobs, runs, published data products, dashboards, machine-learning features, and owners.
Lineage is most useful when it is collected automatically from pipeline execution. Manual diagrams become stale quickly. Runtime lineage can record that run daily_revenue__2026-05-03__001 read raw.orders/dt=2026-05-03, produced gold.daily_revenue/dt=2026-05-03, and fed the executive revenue dashboard. If validation fails after publication, the team can immediately identify which consumers may have seen incorrect data.
| Lineage question | Why it matters during operations |
|---|---|
| Which source fields feed this dashboard metric? | Helps diagnose semantic changes and source-system regressions. |
| Which partitions were produced by the failed run? | Limits recovery work to affected data intervals. |
| Which consumers use this table? | Guides incident communication and prioritization. |
| Which code version produced this data? | Supports rollback, fix-forward, and postmortem analysis. |
| Which quality checks passed or failed? | Distinguishes data defects from infrastructure failures. |
Lineage also changes how teams manage change. Before a producer changes a field, the platform can show downstream consumers. Before an analytics engineer modifies a shared model, the platform can show dashboards and ML features that depend on it. Before a backfill overwrites historical partitions, the platform can show which reports may change. This turns change management from guesswork into an evidence-based workflow.
For TuranMart, the first lineage goal should be modest: collect job-run-dataset events for tier-one pipelines and attach ownership metadata. The second goal should connect those datasets to dashboards and feature tables. The third goal should integrate lineage with incident workflows so that the incident commander can identify affected consumers without opening ten separate tools.
12.6 Alerting, SLO Burn Rate, and Incident Response
Alerts should protect users, not wake engineers for trivia. Prometheus recommends keeping alerting simple, alerting on symptoms, maintaining consoles that help identify causes, and avoiding pages when there is nothing actionable.6 For offline processing systems, it notes that the key metric is how long data takes to get through the system, and for batch jobs it is reasonable to page when the job has not succeeded recently enough to cause user-visible problems.6
This advice is especially important for data teams because pipeline alert noise can become overwhelming. A separate page for every failed retry, every low-level exception, and every transient API timeout trains engineers to ignore alerts. A better alert says: “The tier-one revenue table is projected to miss its freshness SLO unless the current issue is resolved within 20 minutes.”
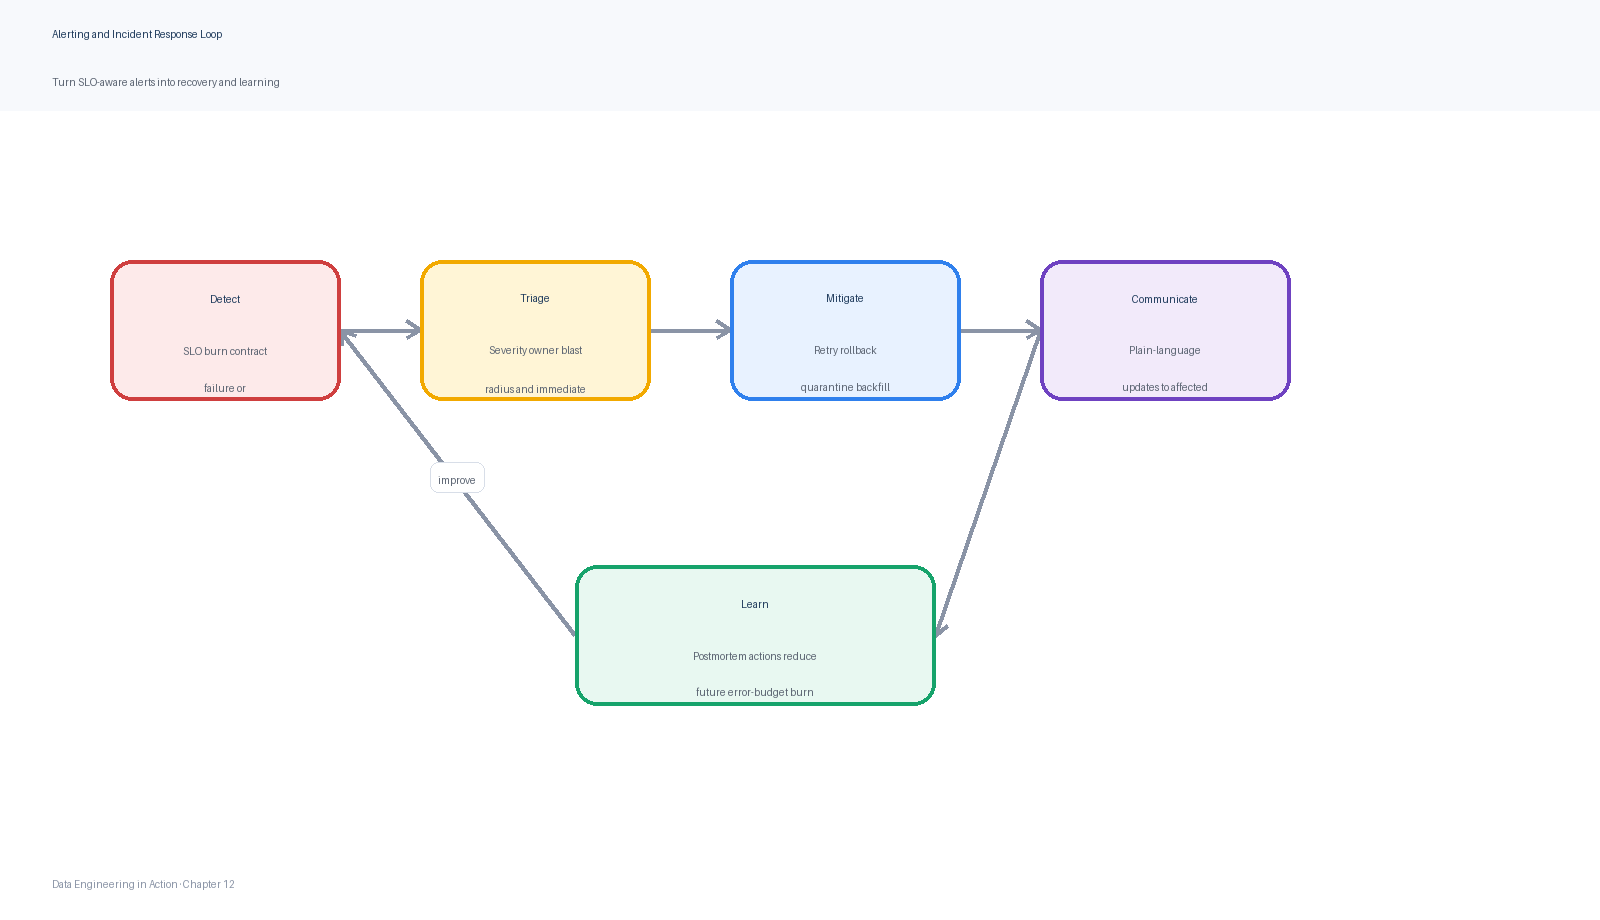
Figure 7:The reliability loop turns SLO-aware alerts into incident response, mitigation, postmortems, and reliability improvements.
The SRE workbook recommends turning SLOs into actionable alerts by detecting significant events that consume a meaningful fraction of the error budget. It evaluates alerting strategies by precision, recall, detection time, and reset time, and introduces burn rate as the speed at which the service consumes the error budget.7 For data products, burn-rate thinking helps teams distinguish a slow-moving issue from an urgent incident.
| Alert type | Example condition | Recommended response |
|---|---|---|
| Page | Tier-one revenue freshness will miss the 07:30 SLO within 30 minutes, or a critical contract failure blocks publishing. | Wake or interrupt the on-call data engineer because user impact is imminent or active. |
| Ticket | A noncritical warning expectation has failed for three consecutive days. | Schedule remediation during working hours. |
| Notification | A retry recovered successfully but consumed part of the error budget. | Inform the owner and track trend; no immediate interruption. |
| Metamonitoring alert | Metrics, logs, or lineage emitters have stopped reporting. | Fix the observability system before relying on its silence. |
Incident response is the human operating model around those alerts. Google SRE argues that effective incident management limits disruption and restores normal business operations quickly.8 It also describes common unmanaged-incident hazards: excessive focus on the technical problem, poor communication, and uncoordinated freelancing.8 Data incidents have the same hazards. One engineer may be debugging Spark, another may be manually editing a table, and a third may be answering stakeholder messages without a shared state document.
A managed data incident should have explicit roles. The incident commander owns coordination and priorities. The operations lead performs mitigations and prevents uncoordinated changes. The communications lead updates stakeholders. The planning or documentation lead maintains the incident record, follow-up actions, and postmortem evidence. For small incidents, one person may hold multiple roles, but the responsibilities should still be explicit.
| Role | Responsibility in a data incident |
|---|---|
| Incident commander | Declares severity, coordinates response, assigns roles, and decides mitigation priority. |
| Operations lead | Executes technical actions such as rollback, rerun, quarantine, or failover. |
| Communications lead | Updates business stakeholders, downstream consumers, and support channels. |
| Planning/documentation lead | Maintains timeline, decisions, affected datasets, and postmortem actions. |
| Producer or domain owner | Explains source-system behavior and approves producer-side fixes. |
A data incident should be declared early when a tier-one data product is stale, incorrect, unavailable, or unexplainable; when multiple teams are needed; when customer or executive decisions may be affected; or when the problem remains unresolved after focused investigation. Early declaration is not failure. It is a mechanism for coordination.
12.7 Reliability Architecture for TuranMart
The reliability layer should be designed as part of the platform, not as a collection of dashboards added after incidents. TuranMart’s target architecture combines pipeline instrumentation, validation, contract enforcement, lineage collection, metrics storage, log search, alerting, and incident management. The architecture is tool-agnostic, but each responsibility must exist somewhere.
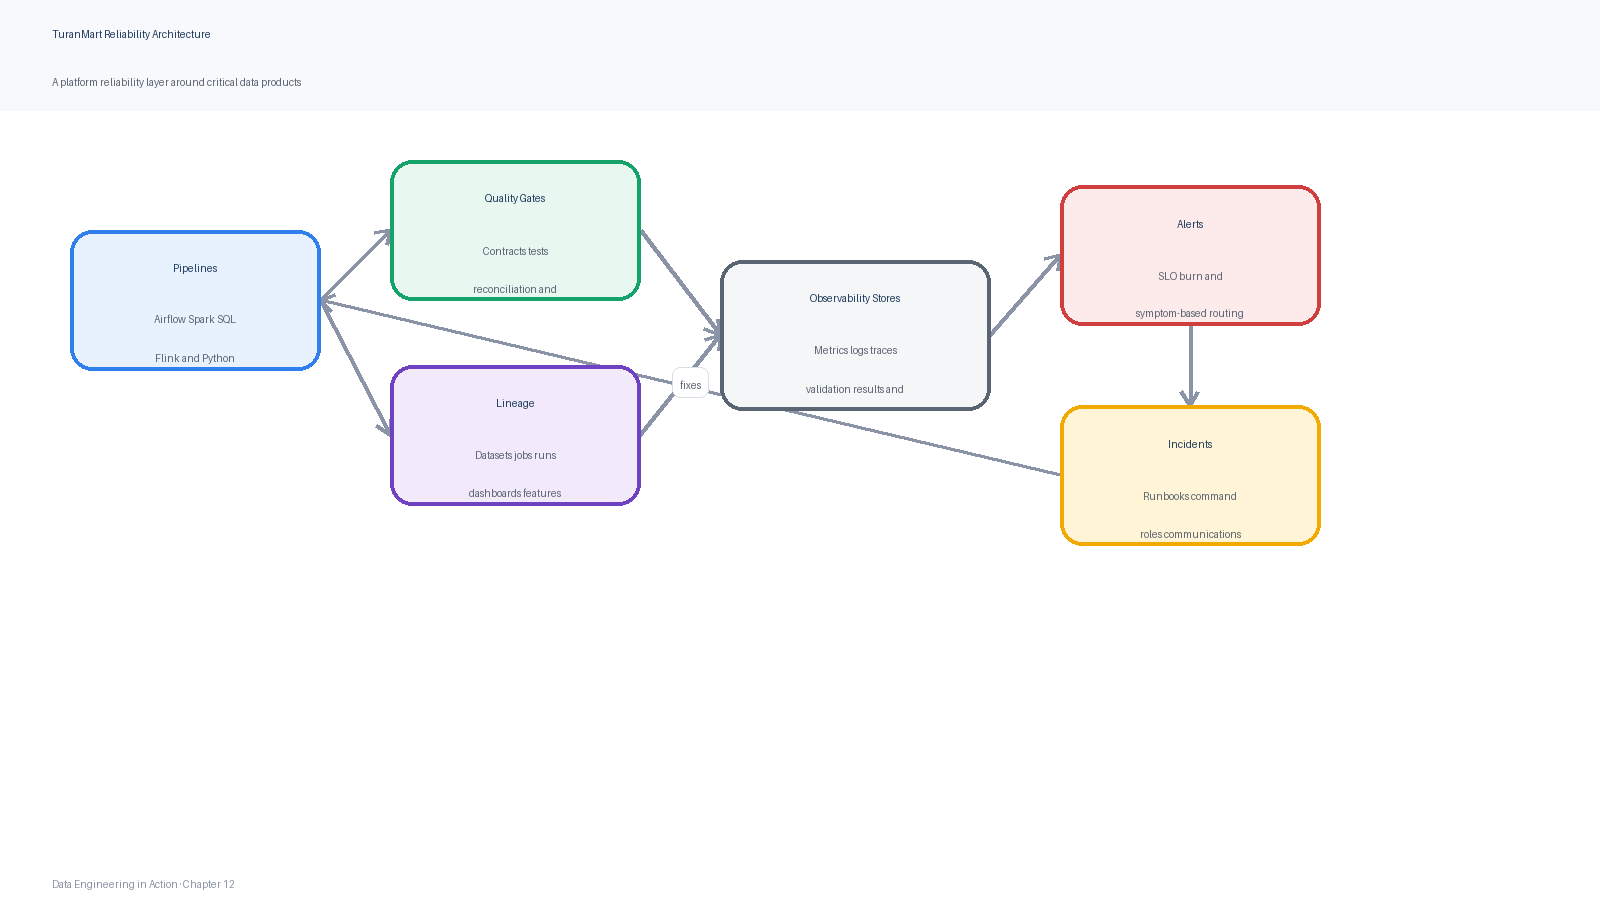
Figure 8:TuranMart reliability architecture: pipelines emit operational evidence into metrics, logs, lineage, and contract systems; SLO-aware alerts route incidents to accountable owners.
| Layer | Responsibility | Example implementation choice |
|---|---|---|
| Pipeline code | Emits structured telemetry and validates contracts. | Python logging, metrics files, OpenTelemetry-compatible spans, quality checks. |
| Orchestration | Records run state, retries, schedules, and data intervals. | Airflow, Dagster, Prefect, or managed orchestration. |
| Quality gate | Blocks publication when critical expectations fail. | Great Expectations-style expectations, dbt tests, custom checks, or warehouse constraints. |
| Lineage service | Records dataset-job-run relationships. | OpenLineage-compatible emitter and catalog integration. |
| Metrics backend | Stores SLI and operational time series. | Prometheus-compatible metrics, warehouse audit tables, or managed monitoring. |
| Alerting | Routes symptoms according to SLO impact. | Alertmanager, cloud monitoring, incident management platform. |
| Incident workflow | Coordinates response, communication, and postmortems. | Runbooks, state documents, ticketing, chat channels, and retrospectives. |
A strong architecture avoids two extremes. The first extreme is observability theater, where many dashboards exist but nobody knows which signal requires action. The second is hero operations, where experienced engineers manually diagnose every issue from memory. The desired state is a boring operating system: tier-one data products have clear SLOs, telemetry is emitted consistently, alerts are symptom-based, runbooks exist, incidents are documented, and postmortems improve the system.
12.8 Common Pitfalls
The most common pitfall is treating job success as data success. A green workflow graph is useful, but it does not prove that data is correct, complete, or fresh. Every tier-one data product needs checks that measure the business promise directly.
A second pitfall is measuring too much and owning too little. Hundreds of metrics without ownership create noise. A small set of SLIs with clear owners creates accountability. Google SRE’s SLI guidance emphasizes selecting representative indicators that matter to users rather than tracking every metric available.2
A third pitfall is paging on causes rather than symptoms. A single user-visible freshness breach may have many possible causes: source outage, warehouse queue, schema drift, permission change, or orchestration bug. Page on the breach or imminent breach, then use dashboards and traces to find the cause.
A fourth pitfall is allowing quality checks to fail silently. Warning-level drift can be recorded for later work, but critical violations must block publication or clearly mark the data product as unsafe. Publishing known-bad data without labeling it creates more damage than being late.
A fifth pitfall is maintaining lineage manually. Manual diagrams are useful for architecture discussions, but operational lineage must come from execution events if it is going to support blast-radius analysis during incidents.
| Pitfall | Symptom | Better practice |
|---|---|---|
| Job success equals trust | Dashboards show incorrect data after green runs. | Require data-product SLIs and quality gates. |
| Alert noise | On-call engineers ignore pages. | Alert on user-visible symptoms and SLO burn. |
| Hidden ownership | Nobody knows who can fix a source change. | Store producer, consumer, and support metadata in contracts. |
| Manual lineage | Incident response depends on tribal knowledge. | Emit job-run-dataset lineage during execution. |
| No postmortems | The same issue returns every month. | Track contributing factors and durable corrective actions. |
Guided Lab: Build a Local Data Observability Harness
In this lab, you will build a deterministic observability and reliability harness for a TuranMart daily revenue pipeline. The lab does not require a cloud account or a running Airflow deployment. Instead, it simulates the operational evidence that a production pipeline should emit and validates that evidence with automated tests.
The lab materials are stored under shared/labs/ch12_observability_reliability/. The solution guide is stored separately under shared/solutions/ch12_observability_reliability/. This separation lets learners attempt the lab before reading the completed answer.
| Lab artifact | Purpose |
|---|---|
data/orders_2026-05-03.csv | Deterministic TuranMart input orders with controlled quality issues. |
contracts/orders_contract.yml | Machine-readable contract describing schema, quality rules, owner, and freshness target. |
src/turanmart_observability/ | Python package implementing validation, metrics, lineage, and incident-output generation. |
run_pipeline.py | Local command that processes the sample partition and writes operational evidence. |
expected/ | Expected deterministic outputs for metrics, validation, lineage, and incident playbook. |
tests/ | Automated tests for contract validation, metric calculation, lineage, and deterministic output. |
shared/labs/ch12_observability_reliability/ci/ch12-observability.yml | Sample CI workflow that teams can copy into .github/workflows/ when repository permissions allow workflow changes. |
Lab Scenario
TuranMart’s gold.daily_revenue data product must be available by 07:30 local time every business day. The source orders file for 2026-05-03 contains mostly valid records, but it also includes a duplicate order, an invalid negative amount, and a late-arriving source timestamp. The platform must detect the quality issues, calculate reliability metrics, emit lineage, and produce an incident playbook when the freshness SLO is at risk.
Step 1: Inspect the Contract
Open contracts/orders_contract.yml and identify the required columns, allowed currencies, uniqueness key, freshness target, owner, support channel, and critical data-quality rules. Notice that the contract combines schema, quality, ownership, and SLO information. This mirrors the operational contract pattern discussed earlier in the chapter.
Step 2: Run the Pipeline
From the lab directory, run the local pipeline command:
python run_pipeline.py --logical-date 2026-05-03The command writes output files under outputs/. The important files are metrics.json, validation_results.json, lineage_events.json, structured_logs.jsonl, and incident_playbook.md.
Step 3: Validate Expected Outputs
Compare the generated files to the deterministic expected outputs:
python validate_outputs.pyA passing validation means the same input, contract, and code produced the same operational evidence as the reference answer.
Step 4: Run the Tests
Run the automated tests:
pytest -qThe tests verify that the lab calculates freshness delay, duplicate counts, invalid amount counts, validation status, lineage events, and incident severity deterministically.
Step 5: Interpret the Incident Playbook
Read outputs/incident_playbook.md. The playbook should identify the failed expectations, affected dataset, logical date, owner, severity, likely impact, immediate mitigation, and follow-up actions. The objective is not only to detect the problem but to create enough context for a real on-call engineer to respond.
Expected Learning Outcomes
After completing the lab, you should be able to explain how a data contract becomes runtime validation, how telemetry connects validation to reliability metrics, how lineage supports blast-radius analysis, and how incident artifacts reduce coordination cost during a failure.
Exercises
Choose a data product from an organization you know and define three SLIs for it. At least one SLI should measure data correctness or completeness rather than infrastructure availability.
Convert one of your SLIs into an SLO and error budget. Explain what engineering decisions should change when the error budget is nearly exhausted.
Write a data contract outline for a source table or event stream. Include schema, ownership, quality rules, freshness expectations, support channel, and change policy.
Design an alerting policy for a daily executive dashboard. Distinguish between page, ticket, and notification conditions.
Draw a lineage graph for a metric that appears in a dashboard. Identify the upstream source, transformation jobs, published tables, dashboard, owner, and possible blast radius of a source change.
Review the guided lab output and propose one additional metric, log field, or lineage facet that would improve incident response.
Review Questions
| Question | What a strong answer should include |
|---|---|
| How is observability different from monitoring? | Monitoring checks known conditions; observability lets engineers ask new questions from emitted evidence. |
| Why is job success not enough for data reliability? | A job can succeed while producing stale, incomplete, duplicated, or semantically wrong data. |
| What is the difference between SLI, SLO, and SLA? | An SLI measures behavior, an SLO defines the target, and an SLA adds explicit consequences. |
| Why are percentiles often better than averages for freshness? | Averages can hide tail delays that affect important partitions or users. |
| What should a data contract include beyond schema? | Quality rules, ownership, support channel, SLO or SLA expectations, change policy, and operational metadata. |
| How does lineage help during an incident? | It identifies affected datasets, jobs, runs, dashboards, features, owners, and downstream consumers. |
| What makes an alert actionable? | It indicates user impact or imminent SLO breach, has an owner, links to evidence, and suggests a response. |
| Why do postmortems matter? | They convert incidents into durable system improvements instead of repeated manual recovery. |
Summary
Data observability and pipeline reliability are the disciplines that make a data platform trustworthy after it becomes complex. Observability combines metrics, logs, traces, lineage, contracts, and quality results so engineers can understand what happened without guessing. Reliability turns those signals into SLIs, SLOs, error budgets, alerts, incident response, and postmortem improvement.
The central lesson of this chapter is that data products should be operated like services. A trusted table needs a freshness objective, quality checks, ownership, lineage, alerting, and recovery evidence. A pipeline run should produce operational artifacts, not only data files. A data incident should have severity, roles, communication, mitigation, and follow-up actions.
In the next chapters, this reliability foundation becomes essential for governance, security, cloud architecture, and cost management. A platform cannot govern what it cannot observe, secure what it cannot inventory, or optimize what it cannot measure.