TuranMart’s marketplace team learned a painful lesson during the spring campaign. Marketing reported 118,000 active customers, finance reported 111,000 billable customers, and product reported 126,000 reachable customers. None of the teams was careless. Each team had written its own SQL against the same raw order, refund, and customer tables, but each used a slightly different definition for canceled orders, test customers, return windows, and customer activity. The warehouse contained the data, but it did not yet contain a trusted model of the business.
Analytics engineering is the discipline that closes this gap. It treats transformation logic, tests, documentation, lineage, and metric definitions as production software rather than as isolated analyst queries. In a modern data platform, extract and load systems move data into the lakehouse or warehouse; orchestration systems schedule the work; batch and streaming engines compute at scale; and analytics engineering turns raw facts into stable, documented, tested, and reusable data products.
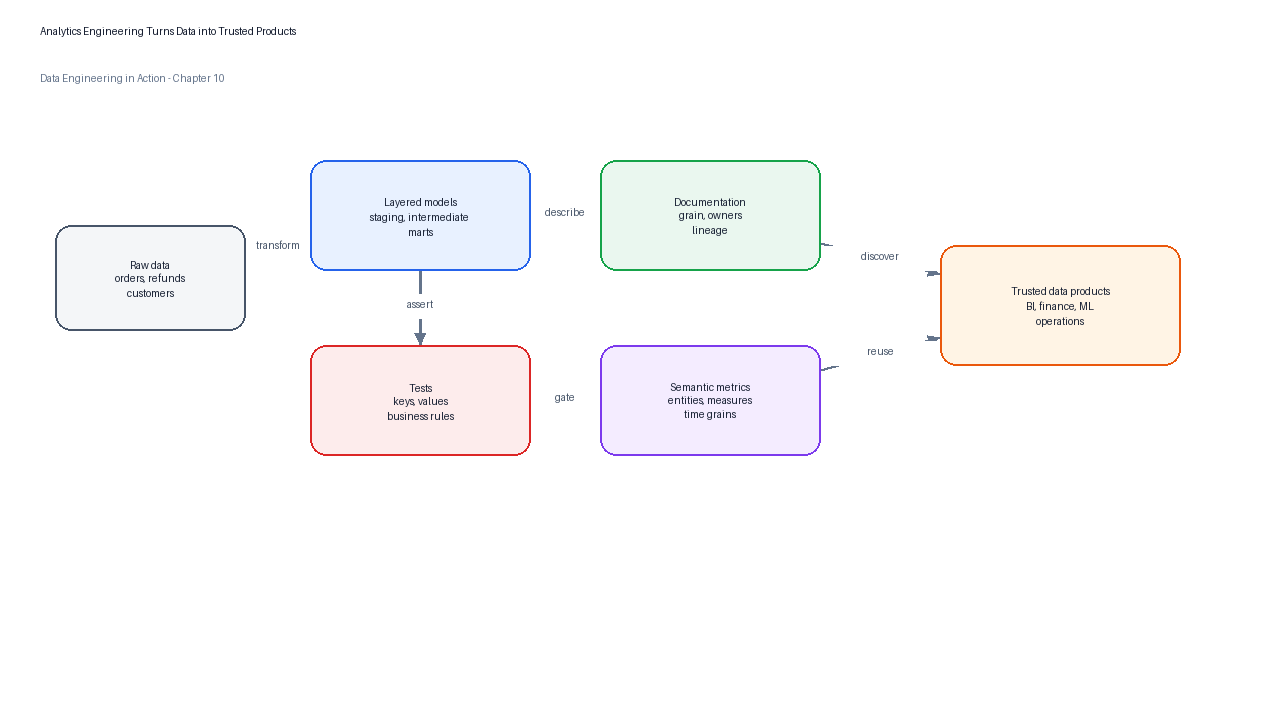
Figure 1:Chapter 10 follows the path from raw source data to governed analytics products: layered models, tests, documentation, semantic metrics, workflow, and platform integration.
Learning Objectives
By the end of this chapter, you will be able to explain why transformation logic belongs in version-controlled projects, design a layered modeling pattern with staging, intermediate, mart, and semantic layers, and distinguish between unit tests, data tests, business assertions, and release gates. You will also be able to document model grain and lineage, define stable metrics, choose appropriate materializations, and run a guided analytics-engineering lab that builds a small but production-shaped transformation project.
10.1 From Raw Data to Trusted Models
Raw data is usually a record of operational events, not a record of business truth. An order-service table may contain retries, payment reversals, customer-service corrections, deleted carts, internal test accounts, and events that arrived late from mobile devices. A finance stakeholder rarely wants to query those facts directly. They want a table where one row means one completed order, where revenue excludes refunded amounts according to a written policy, and where every column has a name that a non-engineer can understand.
A transformation project converts loaded data into this shared analytical surface. In dbt terminology, a project is organized around a dbt_project.yml file and resources such as models, seeds, data tests, macros, docs, sources, exposures, metrics, and semantic models.1 The specific tool matters less than the discipline: model code is kept in a repository, reviewed before deployment, tested in continuous integration, documented for consumers, and deployed on a schedule that is visible to the rest of the data platform.
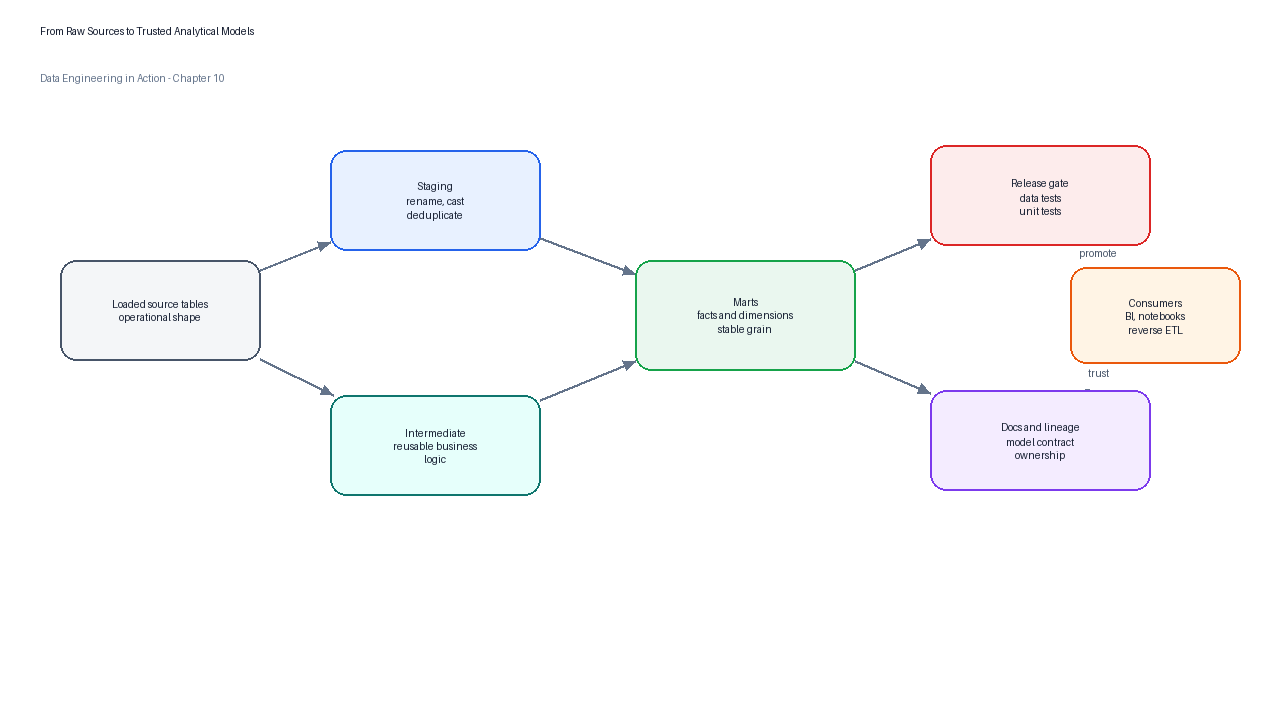
Figure 2:A trusted model pipeline turns raw operational records into reusable analytics products by combining SQL transformations, tests, documentation, and semantic definitions.
The important shift is that the warehouse stops being only a storage system and becomes a software delivery environment. SQL files define behavior. YAML files define tests and documentation. Pull requests describe the change being introduced. Production runs materialize only the models that should become reliable interfaces for downstream dashboards, notebooks, applications, and machine-learning features.
| Layer | Primary question | Typical owner | Common failure when omitted |
|---|---|---|---|
| Raw or landing | What arrived from source systems? | Data platform team | Analysts repeatedly reverse-engineer operational schemas. |
| Staging | What does each source field mean after cleaning and naming? | Analytics engineer | Every mart repeats casting, renaming, and deduplication logic. |
| Intermediate | What reusable business process should be encoded once? | Analytics engineer and domain expert | Complex joins are copied into many reports with slight differences. |
| Mart | What stable table should consumers query? | Data product owner | Dashboards depend on fragile internal transformation details. |
| Semantic | What metric definition should every tool share? | Analytics lead and business owner | Revenue, conversion, and retention drift across teams. |
For TuranMart, the first target is not to build the largest possible transformation graph. The target is to build a small trusted spine: clean order events, classify order status, join customer segments, calculate revenue, expose daily mart tables, and validate the results with deterministic tests.
10.2 The Layered Modeling Pattern
Layering is the most practical way to keep transformation code understandable. Each layer has a deliberately narrow responsibility. Staging models adapt source data into a consistent internal style. Intermediate models encode reusable business logic. Mart models present stable facts and dimensions to consumers. Semantic definitions describe measures, dimensions, entities, and metric names that BI tools and applications can share.
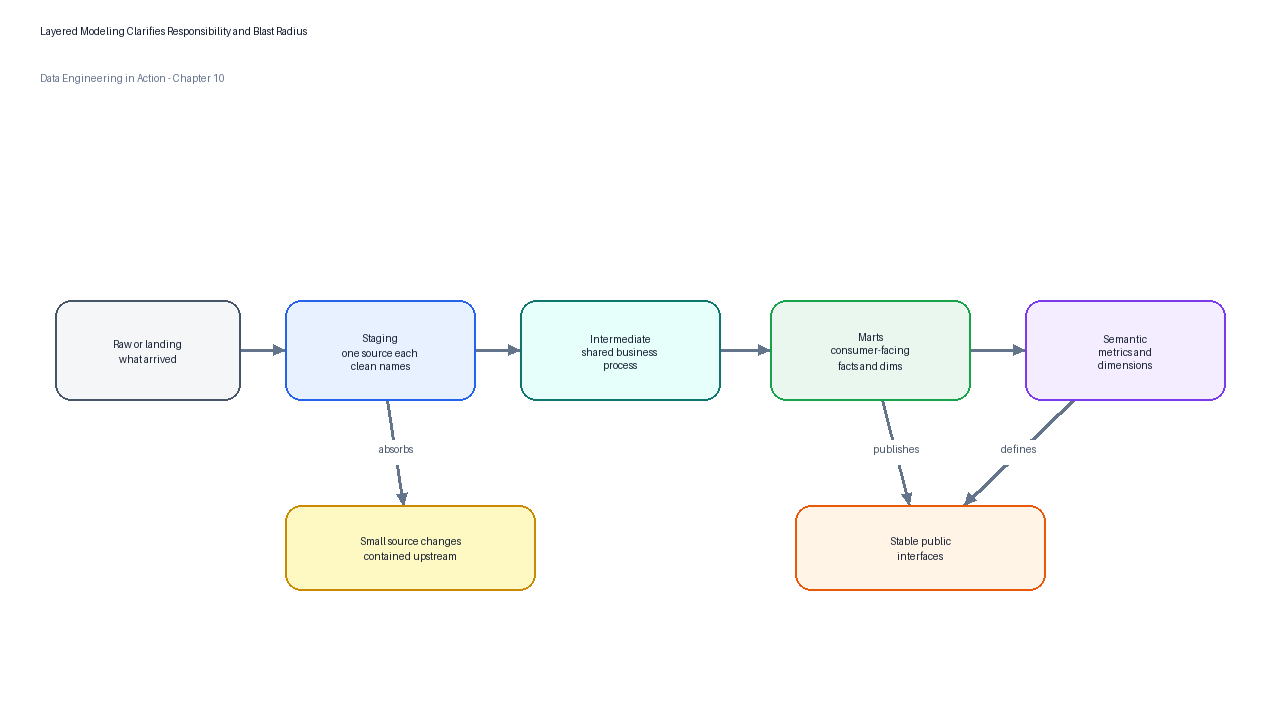
Figure 3:Layered modeling separates source adaptation, reusable business rules, consumer-facing marts, and metric definitions so that each change has a clear owner and blast radius.
Staging Models
A staging model should be boring. It normally contains one source relation, standardized column names, type casts, simple status normalization, light deduplication, and source-specific cleanup. If raw_orders contains ORDER_ID, createdAt, and gross_amt, the staging model might expose order_id, created_at, and gross_amount. This is not yet the place to calculate lifetime value or customer retention.
The staging layer gives the rest of the project a common language. It also makes source changes easier to isolate. If the order service renames gross_amt to gross_amount_cents, the staging model absorbs the source change while downstream models continue to refer to the stable analytical name.
Intermediate Models
Intermediate models encode reusable business processes. TuranMart might create an intermediate model named int_order_financials that calculates net order amount after refunds, shipping, and loyalty credits. Another intermediate model might assign each order to a marketing attribution window. These transformations are too business-specific for staging and too reusable to hide inside one dashboard table.
Intermediate models should not become a junk drawer. If a model has no coherent grain, no clear downstream reuse, and no written reason to exist, it is probably just a temporary query that should be refactored or removed. The strongest intermediate models can be explained in one sentence: one row per order with financial adjustments, one row per customer per month with lifecycle state, or one row per product per day with inventory movement.
Mart Models
Mart models are the consumer-facing interface. They should be stable enough that a dashboard, notebook, reverse-ETL job, or machine-learning feature can depend on them without understanding the internal transformation graph. The most common mart pattern combines fact tables, which record measurable business events, and dimension tables, which describe entities such as customers, merchants, products, or stores.
A good mart model states its grain in the first sentence of its documentation. For example, fct_orders might be documented as “one row per completed customer order after excluding internal test accounts and canceled authorizations.” This statement is not cosmetic. It tells every downstream user which joins are safe, which aggregations are meaningful, and which filters would change the meaning of a metric.
Semantic Models and Metrics
A semantic layer adds business meaning above physical tables. dbt semantic models, for example, define a semantic graph with entities, dimensions, measures, and defaults such as the aggregation time dimension.4 The value of this layer is not that it hides SQL from everyone. The value is that it gives teams one governed place to define metrics such as gross merchandise value, net revenue, active customers, order conversion, and return rate.
Metric definitions drift when every team writes its own numerator, denominator, date filter, and exclusion logic. A semantic model reduces that drift by tying metrics to documented entities and dimensions. It does not remove the need for business agreement, but it makes the agreement executable.
10.3 Transformations as Software
Analytics engineering borrows from software engineering because transformation code has the same failure modes as application code. A small change can break consumers. A dependency can behave differently in production than in development. A refactor can produce the same schema but different numbers. A model can be technically correct and still violate the business contract that users rely on.
Version control is the first control point. Every model change should answer four questions before it reaches production: what business behavior changed, what tests prove the change, what downstream assets are affected, and whether the change is backward compatible. In mature projects, final models are often treated like APIs. dbt model-versioning guidance frames shared final models as interfaces where producers need to evolve logic while consumers need stable queries, migration windows, and deprecation paths.8
| Software-engineering habit | Analytics-engineering equivalent | Practical outcome |
|---|---|---|
| Code review | Pull-request review of SQL, YAML, tests, and docs | Business logic is inspected before it becomes production truth. |
| Unit testing | Static-input checks for complex SQL logic | Edge cases fail before a full model is built. |
| Integration testing | Data tests against built models and sources | Broken keys, duplicates, and invalid values are caught after materialization. |
| Release notes | Model-change notes and exposure impact | Dashboard owners understand what changed and why. |
| API compatibility | Model contracts, versions, and deprecation dates | Mature public models can evolve without surprise breakage. |
Materialization choices are another software-like design decision. dbt supports built-in materializations such as views, tables, incremental models, ephemeral models, and materialized views.5 Views are convenient and current but can be slow if stacked deeply. Tables are fast for consumers but must be rebuilt. Incremental models reduce build time by processing new or changed records, but they require careful logic. Ephemeral models keep the warehouse tidy by inlining reusable logic, but overuse can make compiled SQL harder to debug. The production question is not “which materialization is best,” but “which materialization matches the model’s grain, cost, freshness, and consumer expectations?”
10.4 Testing Data Like Software
Testing is the difference between a transformation project and a folder of hopeful SQL. dbt data tests are assertions about project resources, and dbt test reports whether they pass or fail. Generic tests include unique, not_null, accepted_values, and relationships; singular tests are custom SQL queries that return failing records. A data test passes when its query returns zero failing rows.2
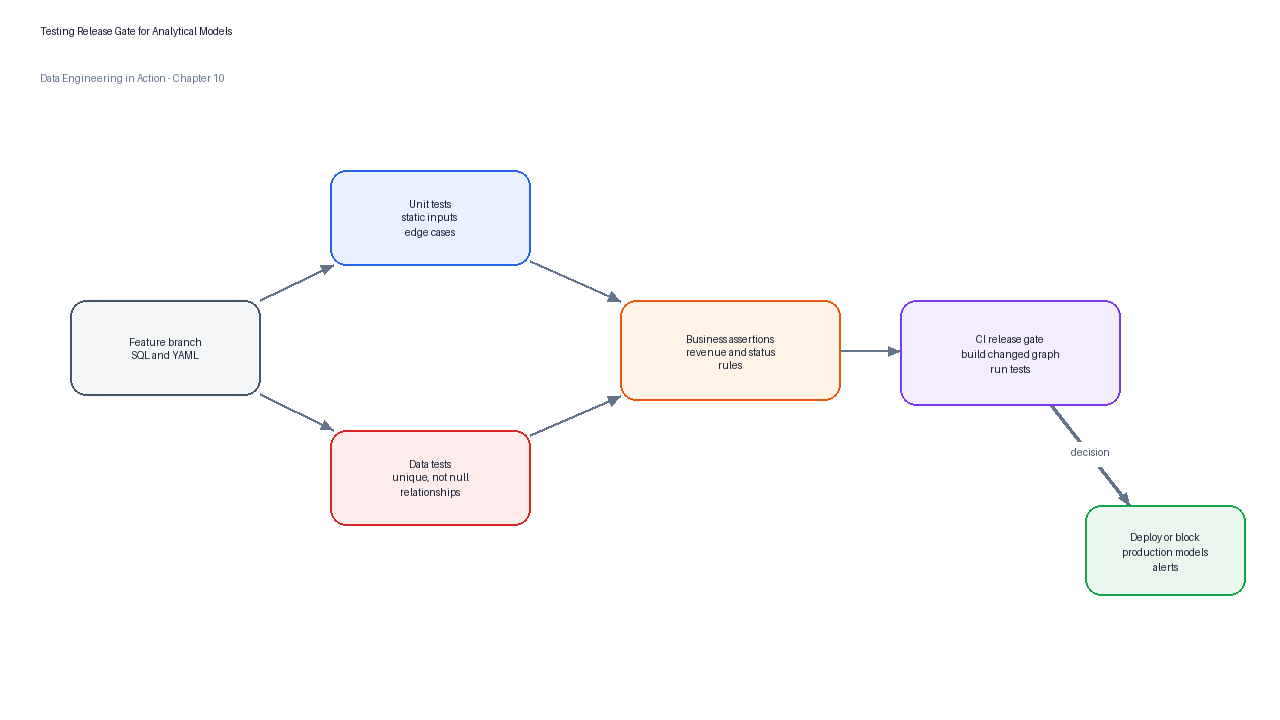
Figure 4:A testing release gate combines logic tests, structural checks, relationship tests, and business assertions before a model is promoted for consumption.
The best test suites are layered just like models. A staging model needs source freshness assumptions, type checks, accepted status values, and not-null keys. An intermediate model needs relationship tests and business invariants. A mart model needs uniqueness at its declared grain, not-null dimensions required by dashboards, and singular tests for finance or operations rules.
| Test category | Example assertion | Where it belongs | Failure meaning |
|---|---|---|---|
| Not-null key | order_id is never null | Staging and facts | The model cannot be joined safely. |
| Uniqueness | One row per order_id in fct_orders | Facts and dimensions | The declared grain is false. |
| Accepted values | order_status is one of completed, canceled, returned | Staging and marts | A source or transformation introduced an unhandled state. |
| Relationship | Every fact customer_id exists in dim_customers | Facts | Referential integrity is broken. |
| Business invariant | Net revenue is never negative for completed orders | Intermediate or mart | Business logic or source correction handling is wrong. |
| Reconciliation | Daily mart revenue matches the finance control total within tolerance | Mart | The analytics product cannot be trusted for reporting. |
Unit tests complement data tests. dbt unit tests validate SQL modeling logic against static inputs before the full model is materialized, and the documentation recommends them for complex logic such as regular expressions, date math, window functions, large case when statements, prior bug fixes, edge cases, and high-criticality models.6 In practice, use unit tests when the transformation logic itself is tricky, and use data tests when the resulting data must satisfy a contract.
A failed test should create a decision, not a mystery. Some failures should block deployment. Others should warn and open an investigation. A duplicate primary key in fct_orders should usually fail the release. A small number of missing optional marketing attributes may be a warning if the downstream dashboard can tolerate them. The test definition should therefore include severity, owner, and operational response.
10.5 Documentation, Lineage, and Discoverability
Documentation is part of the product, not a cleanup task after the product is finished. dbt documentation can include model code, the project DAG, tests, warehouse metadata, column data types, table sizes, and user-written descriptions.3 This generated documentation becomes the catalog that helps analysts, engineers, and business users answer a practical question: “Can I safely use this model for my decision?”
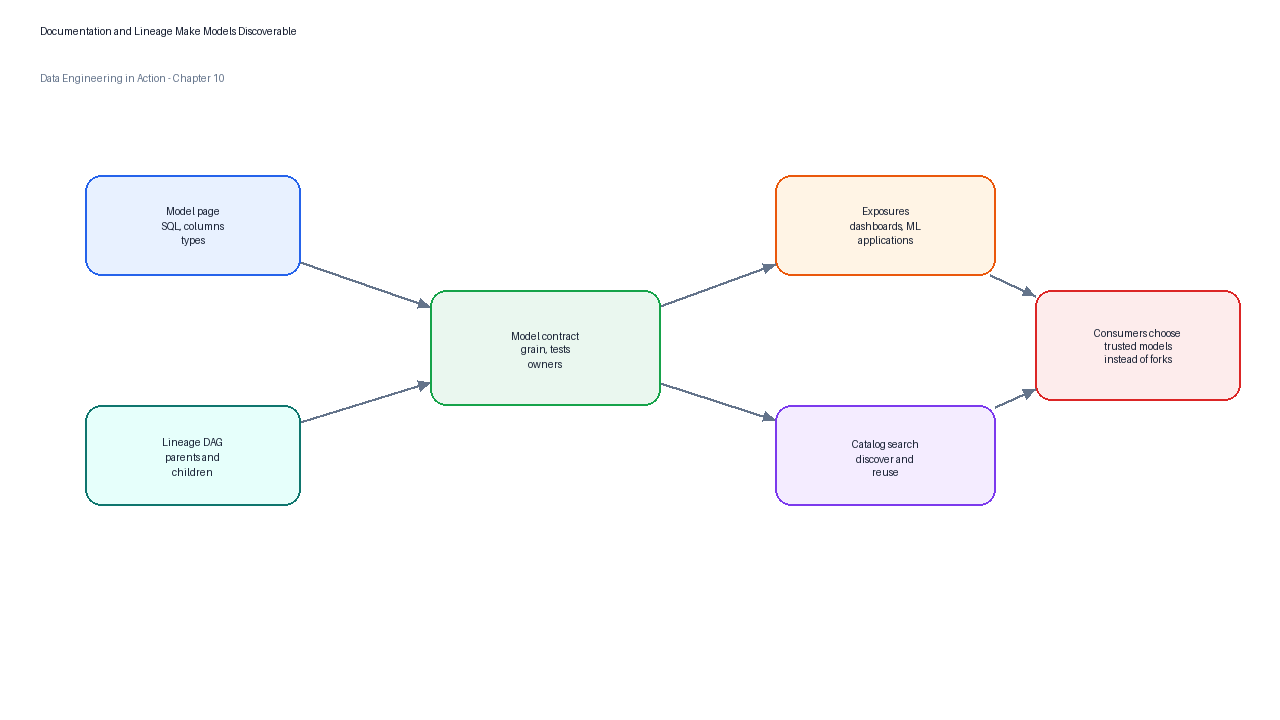
Figure 5:A documentation and lineage catalog turns transformation code into an inspectable product surface with grain, owners, tests, dependencies, and downstream consumers.
The most valuable documentation sentence is the model grain. It should appear at the beginning of every mart description. A grain statement such as “one row per completed order” prevents the most common analytical mistakes: double counting facts after joins, grouping by dimensions at the wrong level, or comparing models that encode different versions of a business event.
| Documentation field | Example for fct_orders | Why it matters |
|---|---|---|
| Grain | One row per completed customer order | Defines safe aggregation and join behavior. |
| Owner | Marketplace analytics engineering | Identifies who can approve changes. |
| Refresh cadence | Hourly after order-service ingestion | Sets freshness expectations. |
| Key tests | Unique and not-null order_id; valid status; customer relationship | Shows why the model can be trusted. |
| Exclusions | Internal test accounts and canceled authorizations are removed | Prevents silent differences across teams. |
| Downstream exposures | Executive revenue dashboard and merchant payout report | Shows business impact of changes. |
Exposures extend lineage beyond the transformation graph. In dbt, exposures define downstream uses of a project such as dashboards, notebooks, analyses, machine-learning pipelines, applications, and other data products.7 This is important because a model is rarely valuable in isolation. It is valuable because a dashboard, finance close process, alert, experiment analysis, or merchant-facing application depends on it.
Documentation also changes team behavior. A well-documented model invites reuse. A poorly documented model encourages every analyst to write a private query. If the same business definition appears in five dashboard workbooks, the transformation project has not yet done its job.
10.6 Semantic Modeling and Metrics
Metrics are where technical correctness and business agreement meet. A SQL query can be syntactically correct, pass its tests, and still encode the wrong definition of active customer. Semantic modeling forces the team to name the entity, measure, dimension, and time grain behind each metric.
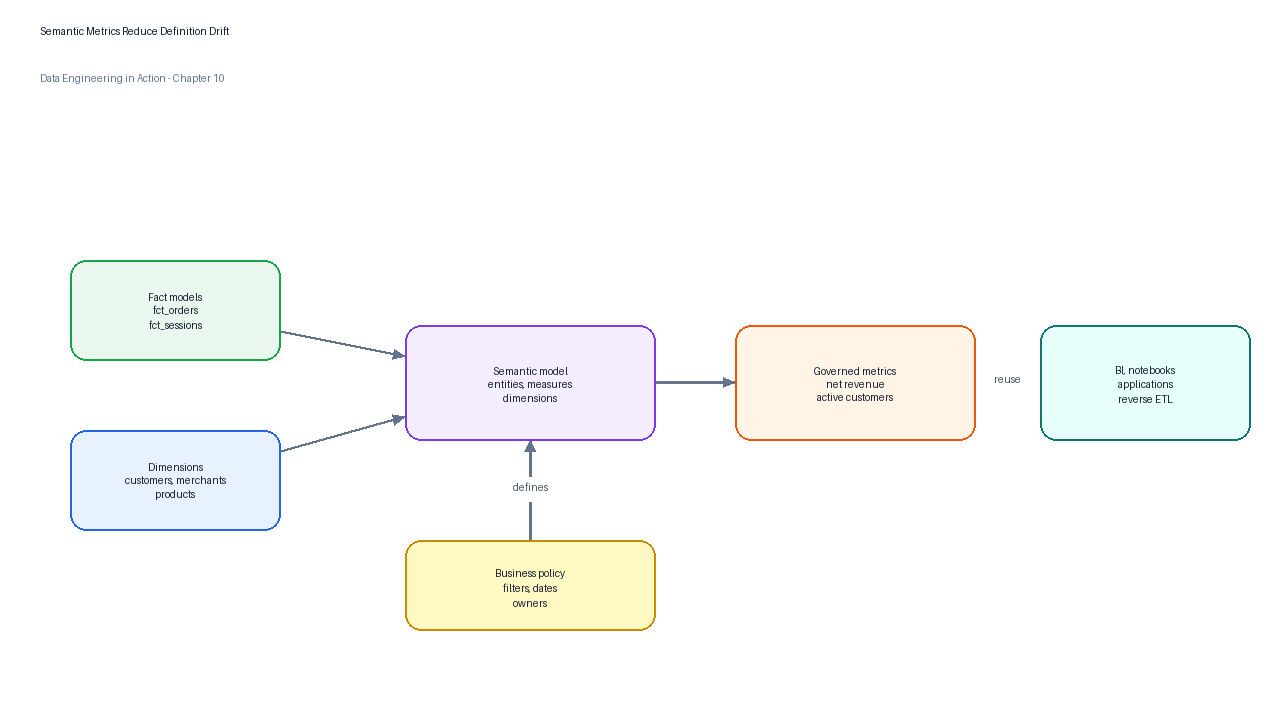
Figure 6:A semantic metrics layer gives BI tools, notebooks, applications, and operational reports a shared definition of measures, dimensions, entities, and time grains.
Consider TuranMart’s net_revenue metric. The measure might sum net_amount from fct_orders. The default time dimension might be order_completed_at. The entity might be order, with foreign entities for customer, merchant, and campaign. Dimensions might include country, merchant category, customer segment, and order channel. The metric definition should also state whether refunds are recognized on order date or refund date, because that policy changes daily results.
| Metric design element | TuranMart example | Design question |
|---|---|---|
| Entity | order | What business object does each fact represent? |
| Measure | sum(net_amount) | What numeric field is aggregated? |
| Time dimension | order_completed_at | Which date controls reporting periods? |
| Dimensions | country, channel, merchant category | How may the metric be sliced? |
| Filters | exclude internal accounts and canceled authorizations | Which records are outside the metric contract? |
| Owner | Finance analytics | Who can approve a definition change? |
Semantic layers do not eliminate debate. They move debate to the right place. Instead of discovering conflicting revenue definitions in an executive meeting, the team resolves the definition in code, review, tests, documentation, and metric metadata. Once agreed, the metric can be reused by BI tools, notebooks, applications, and reverse-ETL pipelines.
10.7 A dbt-Style Analytics Engineering Workflow
A reliable analytics engineering workflow is a controlled path from local development to production deployment. The workflow begins with a small change in a feature branch, continues through local model runs and tests, passes through peer review and continuous integration, and ends with scheduled production deployment, documentation generation, and operational monitoring.
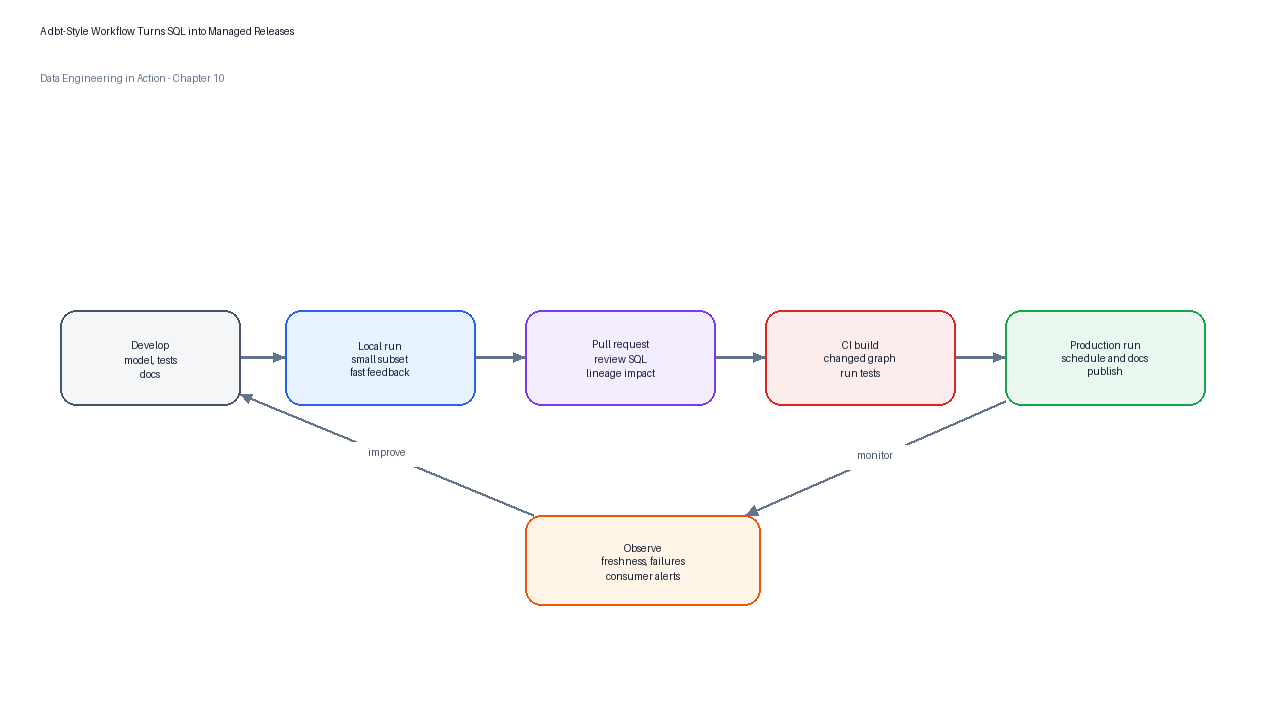
Figure 7:A dbt-style workflow turns SQL changes into managed software releases with review, tests, deployment, generated documentation, and monitoring.
A practical team workflow has five stages. First, the analytics engineer creates or modifies a model in a feature branch and runs the smallest relevant subset locally. Second, the engineer adds or updates YAML metadata, tests, and documentation in the same change. Third, continuous integration builds only the changed models and their dependencies, then runs unit and data tests. Fourth, reviewers inspect the SQL, grain, naming, tests, and downstream impact. Fifth, production orchestration deploys the approved graph and publishes documentation.
| Workflow stage | Typical command or artifact | Review question |
|---|---|---|
| Develop | Model SQL, YAML, fixtures, and local run | Does the model have one clear responsibility? |
| Validate locally | Unit tests, data tests, and expected outputs | Does the change handle known edge cases? |
| Review | Pull request with compiled SQL and lineage impact | Could this break a dashboard or metric? |
| Deploy | Scheduled production run and docs generation | Was the correct subset promoted? |
| Observe | Run history, failed tests, freshness checks, and exposure alerts | Did the change improve reliability in production? |
The most common anti-pattern is to separate SQL changes from tests and documentation. That creates a false sense of speed. The model may be built quickly, but every downstream user pays the cost later when they cannot understand or trust it. A second anti-pattern is to materialize every model as a table. Tables may make dashboards fast, but they increase storage cost and rebuild time when used indiscriminately. A third anti-pattern is to let semantic metrics live only inside BI dashboards. When metric logic is trapped in a dashboard, it cannot be reviewed, tested, versioned, or reused consistently.
10.8 Analytics Engineering in the Broader Platform
Analytics engineering sits between the platform and the business. It depends on ingestion, storage, orchestration, metadata, identity, and governance, and it produces the curated models that BI, reverse ETL, machine learning, finance, operations, and product analytics consume.
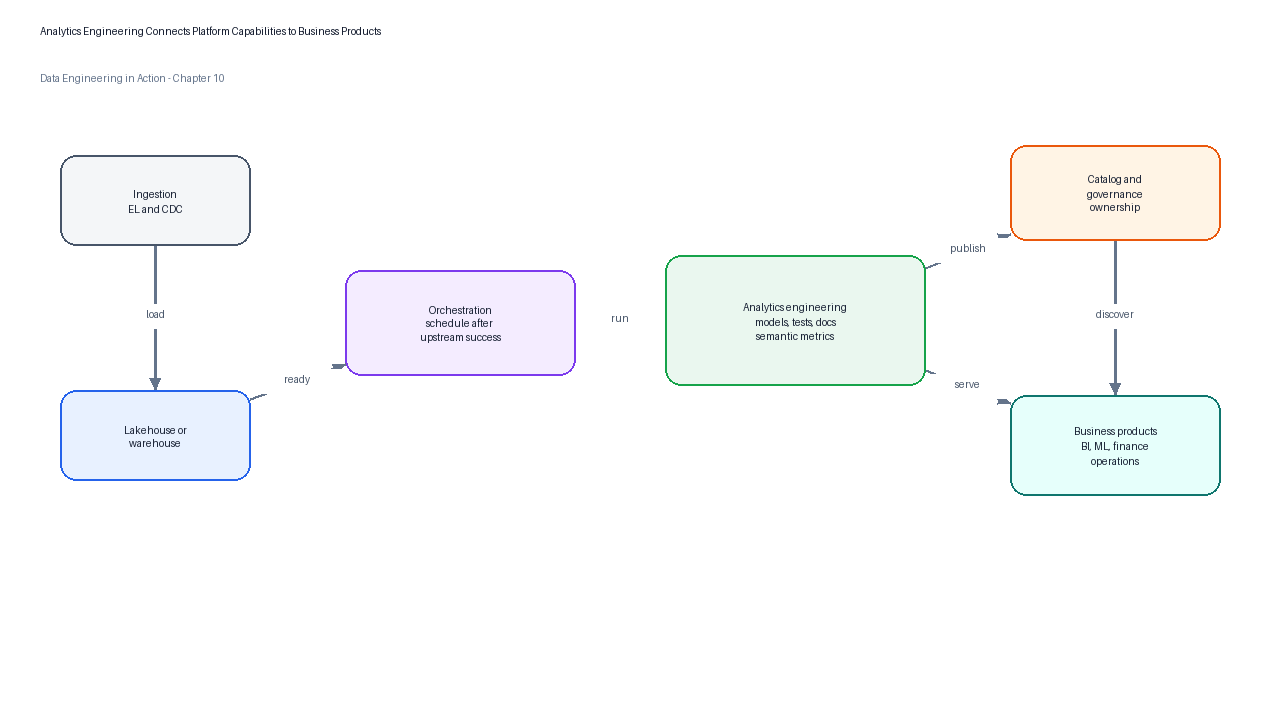
Figure 8:Analytics engineering is the transformation and trust layer connecting raw platform capabilities to business-facing data products.
The interface with orchestration is especially important. Transformation jobs should be scheduled after upstream ingestion has completed and before downstream dashboards refresh. Failed tests should produce visible alerts, not silent broken dashboards. Freshness and reconciliation checks should be part of the run contract. When a high-criticality mart fails, the orchestrator should stop downstream publication or clearly mark the asset as stale.
The interface with governance is equally important. Mature public models need owners, access rules, contracts, versioning policies, and deprecation windows. A model used by finance close or customer-facing reporting cannot change like an exploratory notebook. It must change like a public API: carefully, visibly, and with a migration path.
10.9 Guided Lab: Build a Tested Analytics Engineering Project
In this lab, you will build a small analytics-engineering project for TuranMart using local files and Python. The lab intentionally uses DuckDB-style SQL concepts implemented through a deterministic Python runner so that the workflow is easy to execute in a local environment without cloud warehouse credentials. You will create staged models, intermediate business logic, mart tables, documentation metadata, semantic metric definitions, and validation results.
Scenario
TuranMart wants one trusted daily revenue table for its marketplace leadership dashboard. Raw order events include completed orders, canceled orders, returned orders, internal test accounts, and customer segments. Your job is to turn those records into tested models and a documented metric contract for daily net revenue.
Lab Materials
The lab assets are located in shared/labs/ch10_analytics_engineering/, and the completed explanation is located in shared/solutions/ch10_analytics_engineering/solution_guide.md. The generator script scripts/create_ch10_lab_assets.py recreates the lab from scratch for maintainers.
| File | Purpose |
|---|---|
data/raw_orders.csv | Deterministic raw order events with normal, canceled, returned, and internal records. |
data/raw_customers.csv | Customer segment and geography attributes. |
models/staging/stg_orders.sql | Source cleanup, naming, type casting, and status normalization. |
models/staging/stg_customers.sql | Customer staging model with standardized fields. |
models/intermediate/int_order_financials.sql | Reusable financial business logic for gross, refund, discount, and net amounts. |
models/marts/fct_orders.sql | Consumer-facing fact table at one row per reportable order. |
models/marts/daily_revenue.sql | Daily revenue mart for dashboard consumption. |
models/schema.yml | Model descriptions, column descriptions, and data-test declarations. |
semantic/metrics.yml | Semantic metric definition for daily net revenue. |
run_pipeline.py | Deterministic runner that builds CSV outputs from the model definitions. |
validate_outputs.py | Validator that checks expected rows, schema, tests, and metrics. |
expected/daily_revenue.csv | Expected daily mart output for comparison. |
Step 1: Run the Pipeline
From the repository root, run the following command:
python3 shared/labs/ch10_analytics_engineering/run_pipeline.pyThe runner reads the raw CSV files, applies the staged and intermediate transformation logic, writes model outputs under shared/labs/ch10_analytics_engineering/output/, and writes a JSON test report. It deliberately mirrors the analytics-engineering workflow even though it does not require a live dbt adapter.
Expected generated files include stg_orders.csv, stg_customers.csv, int_order_financials.csv, fct_orders.csv, daily_revenue.csv, and test_report.json.
Step 2: Validate the Models
Run the validator:
python3 shared/labs/ch10_analytics_engineering/validate_outputs.pyA successful run prints a validation summary showing that the daily revenue output matches the expected CSV, required columns exist, uniqueness and not-null checks pass, canceled and internal orders are excluded, and the semantic metric definition matches the mart. If the validator fails, inspect output/test_report.json first; it contains the test names, severity, and failure counts.
Step 3: Inspect the Mart Grain
Open models/marts/fct_orders.sql and confirm that the mart grain is one row per reportable order. Then open models/schema.yml and find the corresponding model description. The lab is considered complete only when the model code, documentation, and tests tell the same story.
Step 4: Trace the Metric Definition
Open semantic/metrics.yml and identify the measure, entity, time dimension, and dimensions behind daily_net_revenue. Then compare it with output/daily_revenue.csv. The goal is to connect the physical model to the governed metric definition instead of treating the dashboard query as the only source of truth.
Step 5: Make a Safe Change
As an exercise, change one customer segment or order status in the raw input and rerun the pipeline and validator. If the change violates the contract, the validator should fail. If the change is legitimate, update the expected output and explain why the business definition changed.
Cleanup
The lab writes outputs only under shared/labs/ch10_analytics_engineering/output/. To reset the generated files, run:
rm -rf shared/labs/ch10_analytics_engineering/outputThen rerun the pipeline and validator. The run is deterministic, so repeated executions with unchanged inputs should produce the same expected output.
10.10 Common Pitfalls
The first pitfall is building marts before defining grain. Without grain, no one knows whether the model can be safely joined, grouped, or filtered. The second pitfall is using tests only for primary keys. Primary-key tests are necessary, but they do not prove that revenue, status, refunds, and exclusions follow the business contract. The third pitfall is hiding metric logic in dashboards. Dashboard formulas are hard to review, hard to test, and easy to fork.
A fourth pitfall is overusing incremental models before the full-refresh logic is correct. Incremental materializations can reduce build time, but they add state. If the transformation has not been proven in full-refresh mode, incremental logic may preserve old mistakes indefinitely. A fifth pitfall is treating documentation as optional. If consumers cannot discover the model’s grain, owner, exclusions, and tests, they will either misuse the model or rebuild it privately.
10.11 Exercises
Extend the lab’s
daily_revenuemart with acountrydimension and update the expected output. Explain whether the grain changed.Add a singular business test that fails if a returned order contributes positive net revenue after refund adjustment.
Propose a materialization strategy for each lab model if TuranMart moved the project to a production warehouse. Justify where you would use views, tables, or incremental models.
Add an exposure definition for an executive revenue dashboard. Include owner, maturity, URL placeholder, and dependencies.
Write a migration plan for changing the definition of
active_customerfrom “ordered in the last 90 days” to “completed a non-refunded order in the last 90 days.”
10.12 Review Questions
Why should staging models avoid complex business logic?
What is the difference between a unit test and a data test in an analytics-engineering project?
Why is a model’s grain the most important documentation sentence?
How does a semantic layer reduce metric drift across BI tools and notebooks?
When should a public mart model be versioned instead of changed in place?
What are the trade-offs between view, table, incremental, and ephemeral materializations?
How do exposures help a team understand the downstream impact of a model change?
Why should tests and documentation be updated in the same pull request as SQL logic?
Chapter Summary
Analytics engineering turns raw data into trusted, tested, documented, and reusable business models. The discipline is not only about writing SQL; it is about treating transformation logic as production software. Layered modeling keeps responsibilities clear. Tests convert assumptions into executable checks. Documentation and lineage make models discoverable and accountable. Semantic definitions reduce metric drift by giving business terms one governed implementation. Workflow, materialization choices, and platform integration determine whether the project remains reliable as usage grows.
For TuranMart, the result is a shared path from raw marketplace events to a daily revenue metric that finance, marketing, product, and executives can trust. The same pattern scales beyond revenue. Every critical analytical domain needs the same foundation: clear grain, reviewed code, deterministic tests, documented ownership, and a metric contract that consumers can reuse.